
Maths Gcse Edexcel Higher
-
Scatter-Graphs-And-Correlation Edexcel Higher2 主题
-
Cumulative-Frequency-And-Box-Plots Edexcel Higher4 主题
-
Histograms Edexcel Higher3 主题
-
Statistical-Diagrams Edexcel Higher7 主题
-
Averages-Ranges-And-Data Edexcel Higher8 主题
-
Capture-Recapture Edexcel Higher
-
Population-And-Sampling Edexcel Higher
-
Comparing-Data-Sets Edexcel Higher
-
Range-And-Interquartile-Range Edexcel Higher
-
Averages-From-Grouped-Data Edexcel Higher
-
Averages-From-Tables Edexcel Higher
-
Calculations-With-The-Mean Edexcel Higher
-
Mean-Median-And-Mode Edexcel Higher
-
Capture-Recapture Edexcel Higher
-
Combined-And-Conditional-Probability Edexcel Higher3 主题
-
Tree-Diagrams Edexcel Higher1 主题
-
Simple-Probability-Diagrams Edexcel Higher3 主题
-
Transformations Edexcel Higher5 主题
-
Vectors Edexcel Higher6 主题
-
3D-Pythagoras-And-Trigonometry Edexcel Higher1 主题
-
Sine-Cosine-Rule-And-Area-Of-Triangles Edexcel Higher4 主题
-
Pythagoras-And-Trigonometry Edexcel Higher4 主题
-
Area-And-Volume-Of-Similar-Shapes Edexcel Higher1 主题
-
Congruence-Similarity-And-Geometrical-Proof Edexcel Higher5 主题
-
Volume-And-Surface-Area Edexcel Higher3 主题
-
Circles-Arcs-And-Sectors Edexcel Higher2 主题
-
Area-And-Perimeter Edexcel Higher4 主题
-
Circle-Theorems Edexcel Higher7 主题
-
Circle-Theorem-Proofs Edexcel Higher
-
The-Alternate-Segment-Theorem Edexcel Higher
-
Angles-In-The-Same-Segment Edexcel Higher
-
Angles-In-Cyclic-Quadrilaterals Edexcel Higher
-
Theorems-With-Chords-And-Tangents Edexcel Higher
-
Angle-In-A-Semicircle Edexcel Higher
-
Angles-At-Centre-And-Circumference Edexcel Higher
-
Circle-Theorem-Proofs Edexcel Higher
-
Bearings-Scale-Drawing-Constructions-And-Loci Edexcel Higher5 主题
-
Angles-In-Polygons-And-Parallel-Lines Edexcel Higher3 主题
-
Symmetry-And-Shapes Edexcel Higher6 主题
-
Exchange-Rates-And-Best-Buys Edexcel Higher2 主题
-
Standard-And-Compound-Units Edexcel Higher5 主题
-
Direct-And-Inverse-Proportion Edexcel Higher2 主题
-
Problem-Solving-With-Ratios Edexcel Higher2 主题
-
Ratios Edexcel Higher3 主题
-
Sequences Edexcel Higher4 主题
-
Transformations-Of-Graphs Edexcel Higher2 主题
-
Graphing-Inequalities Edexcel Higher2 主题
-
Solving-Inequalities Edexcel Higher2 主题
-
Real-Life-Graphs Edexcel Higher4 主题
-
Estimating-Gradients-And-Areas-Under-Graphs Edexcel Higher2 主题
-
Equation-Of-A-Circle Edexcel Higher2 主题
-
Graphs-Of-Functions Edexcel Higher6 主题
-
Linear-Graphs Edexcel Higher4 主题
-
Coordinate-Geometry Edexcel Higher4 主题
-
Functions Edexcel Higher3 主题
-
Forming-And-Solving-Equations Edexcel Higher3 主题
-
Iteration Edexcel Higher1 主题
-
Simultaneous-Equations Edexcel Higher2 主题
-
Quadratic-Equations Edexcel Higher4 主题
-
Linear-Equations Edexcel Higher1 主题
-
Algebraic-Proof Edexcel Higher1 主题
-
Rearranging-Formulas Edexcel Higher2 主题
-
Algebraic-Fractions Edexcel Higher4 主题
-
Completing-The-Square Edexcel Higher1 主题
-
Factorising Edexcel Higher6 主题
-
Expanding-Brackets Edexcel Higher3 主题
-
Algebraic-Roots-And-Indices Edexcel Higher1 主题
-
Introduction Edexcel Higher7 主题
-
Using-A-Calculator Edexcel Higher1 主题
-
Surds Edexcel Higher2 主题
-
Rounding-Estimation-And-Bounds Edexcel Higher2 主题
-
Fractions-Decimals-And-Percentages Edexcel Higher3 主题
-
Simple-And-Compound-Interest-Growth-And-Decay Edexcel Higher4 主题
-
Percentages Edexcel Higher3 主题
-
Fractions Edexcel Higher4 主题
-
Powers-Roots-And-Standard-Form Edexcel Higher4 主题
-
Prime-Factors-Hcf-And-Lcm Edexcel Higher4 主题
-
Number-Operations Edexcel Higher10 主题
-
Product-Rule-For-Counting Edexcel Higher
-
Systematic-Lists Edexcel Higher
-
Related-Calculations Edexcel Higher
-
Multiplication-And-Division Edexcel Higher
-
Addition-And-Subtraction Edexcel Higher
-
Money-Calculations Edexcel Higher
-
Negative-Numbers Edexcel Higher
-
Irrational-Numbers Edexcel Higher
-
Order-Of-Operations-Bidmas-Bodmas Edexcel Higher
-
Mathematical-Symbols Edexcel Higher
-
Product-Rule-For-Counting Edexcel Higher
Frequency-Polygons Edexcel Higher
Exam code:1MA1
Frequency polygons
What are the key features of a frequency polygon?
-
Frequency polygons are a very simple way of showing frequencies for continuous, grouped data and give a quick guide to how frequencies change from one class to the next
-
Apart from plotting and joining up points with straight lines there are 2 rules for frequency polygons:
-
Plot points at the MIDPOINT of class intervals
-
Unless one of the frequencies is 0 do not join the frequency polygon to the x-axis, and do not join the first point to the last one
-
-
The result is not actually a polygon but more of an open one that ‘floats’ in mid-air!
-
You may be asked to draw a frequency polygon and/or use it to make comments and compare data
How do I draw a frequency polygon?
-
This is easiest shown by an example
-
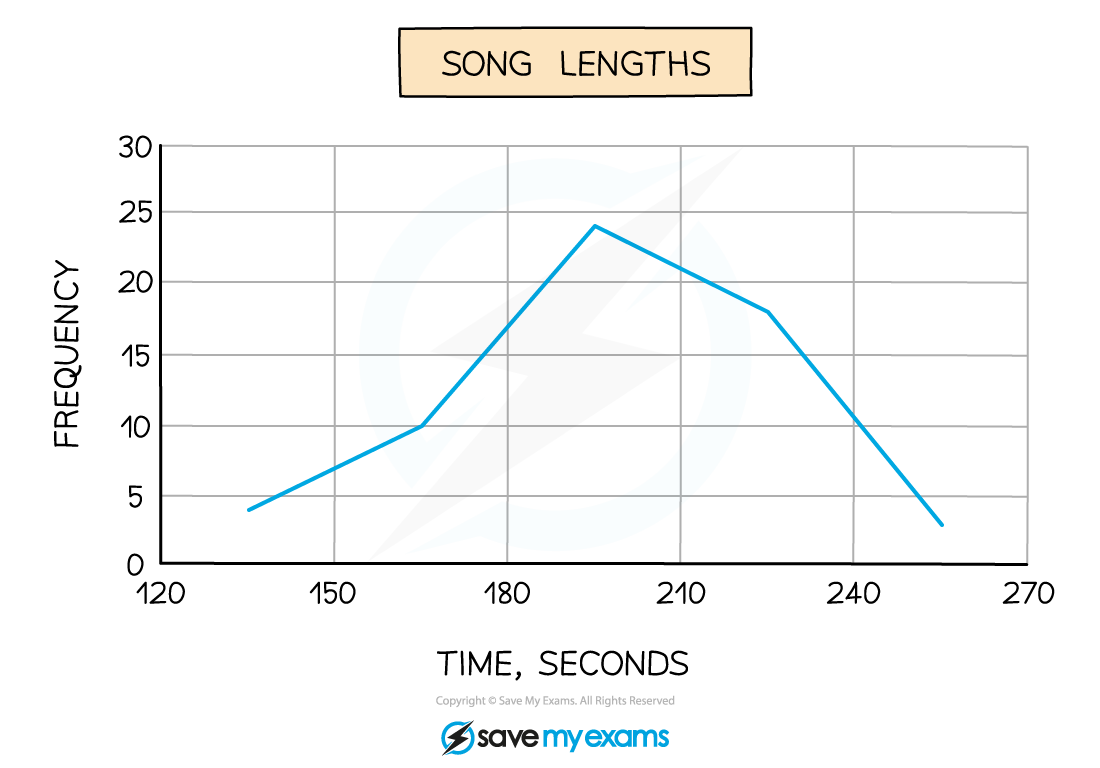
e.g. The lengths of 59 songs, in seconds, are recorded in the table below
-
|
Song length |
Frequency |
|
120 ≤ t < 150 |
4 |
|
150 ≤ t < 180 |
10 |
|
180 ≤ t < 210 |
24 |
|
210 ≤ t < 240 |
18 |
|
240 ≤ t < 270 |
3 |
-
Frequencies are plotted at the midpoints of the class intervals
-
so in this case we would plot the points (135, 4), (165, 10), (195, 24), (225, 18) and (255, 3)
-
Join these up with straight lines (but do not join the last to the first!)
-
How do I use and interpret a frequency polygon?
-
Think about what you could you say about the data above, particularly by looking at the diagram only?
-
The two things to look for are averages and spread
-
The modal class is 180 ≤ t < 210
-
It would be acceptable to say that 195 seconds is (an estimate of) the modal song length
-
The diagram (rather than the table) shows (an estimate of) the range of song lengths is 255 – 135 = 120 seconds
-
If 2 frequency polygons are drawn on the same graph comparisons between the 2 sets of data can be made
-
-
Examiner Tips and Tricks
-
Jot down the midpoints next to the frequencies so you are not trying to work them out in your head while also concentrating on actually plotting the points
Worked Example
A local council ran a campaign to encourage households to waste less food.
To compare the impact of the campaign the council recorded the weight of food waste produced by 30 households in a week both before and after the campaign.
The results are shown in the table below.
|
Food waste |
Frequency |
Frequency |
|
1 ≤ w < 1.4 |
3 |
5 |
|
1.4 ≤ w < 1.8 |
4 |
8 |
|
1.8 ≤ w < 2.2 |
8 |
14 |
|
2.2 ≤ w < 2.6 |
10 |
3 |
|
2.6 ≤ w < 3 |
5 |
1 |
a)
On the same diagram, draw two frequency polygons, one for before the council’s campaign and one for after.
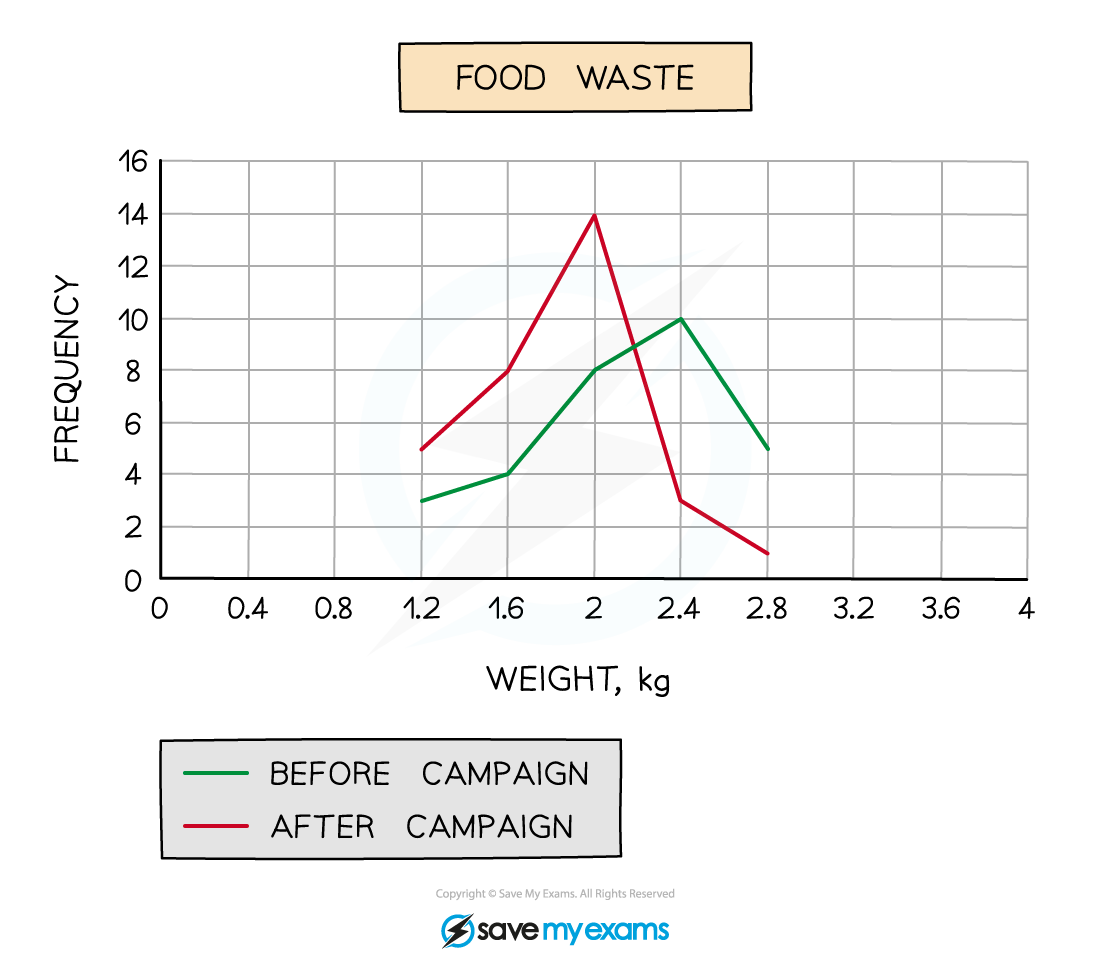
Remember to include a key to show which frequency polygon is which.
b)
Comment on whether you think the council’s campaign has been successful or not and give a reason why.
The council campaign has been successful as the modal amount of waste has reduced from 2.4 kg of food waste per week to 2 kg
Remember to look for average(s) and/or spread – the mode (average) is appropriate in this case.
Responses