
Maths Gcse Aqa Higher
-
Scatter-Graphs-And-Correlation Aqa Higher2 主题
-
Cumulative-Frequency-And-Box-Plots Aqa Higher4 主题
-
Histograms Aqa Higher3 主题
-
Statistical-Diagrams Aqa Higher5 主题
-
Averages-Ranges-And-Data Aqa Higher7 主题
-
Combined-And-Conditional-Probability Aqa Higher3 主题
-
Tree-Diagrams Aqa Higher1 主题
-
Simple-Probability-Diagrams Aqa Higher3 主题
-
Transformations Aqa Higher5 主题
-
Vectors Aqa Higher6 主题
-
3D-Pythagoras-And-Trigonometry Aqa Higher1 主题
-
Sine-Cosine-Rule-And-Area-Of-Triangles Aqa Higher4 主题
-
Pythagoras-And-Trigonometry Aqa Higher4 主题
-
Area-And-Volume-Of-Similar-Shapes Aqa Higher1 主题
-
Congruence-Similarity-And-Geometrical-Proof Aqa Higher5 主题
-
Volume-And-Surface-Area Aqa Higher3 主题
-
Circles-Arcs-And-Sectors Aqa Higher2 主题
-
Area-And-Perimeter Aqa Higher4 主题
-
Circle-Theorems Aqa Higher7 主题
-
Bearings-Scale-Drawing-Constructions-And-Loci Aqa Higher5 主题
-
Angles-In-Polygons-And-Parallel-Lines Aqa Higher3 主题
-
Symmetry-And-Shapes Aqa Higher6 主题
-
Exchange-Rates-And-Best-Buys Aqa Higher2 主题
-
Standard-And-Compound-Units Aqa Higher5 主题
-
Direct-And-Inverse-Proportion Aqa Higher2 主题
-
Problem-Solving-With-Ratios Aqa Higher2 主题
-
Ratios Aqa Higher3 主题
-
Sequences Aqa Higher4 主题
-
Transformations-Of-Graphs Aqa Higher2 主题
-
Graphing-Inequalities Aqa Higher2 主题
-
Solving-Inequalities Aqa Higher2 主题
-
Real-Life-Graphs Aqa Higher4 主题
-
Estimating-Gradients-And-Areas-Under-Graphs Aqa Higher2 主题
-
Equation-Of-A-Circle Aqa Higher2 主题
-
Functions Aqa Higher3 主题
-
Forming-And-Solving-Equations Aqa Higher3 主题
-
Graphs-Of-Functions Aqa Higher6 主题
-
Linear-Graphs Aqa Higher4 主题
-
Coordinate-Geometry Aqa Higher4 主题
-
Iteration Aqa Higher1 主题
-
Simultaneous-Equations Aqa Higher2 主题
-
Quadratic-Equations Aqa Higher4 主题
-
Linear-Equations Aqa Higher1 主题
-
Algebraic-Proof Aqa Higher1 主题
-
Rearranging-Formulas Aqa Higher2 主题
-
Algebraic-Fractions Aqa Higher4 主题
-
Completing-The-Square Aqa Higher1 主题
-
Factorising Aqa Higher6 主题
-
Expanding-Brackets Aqa Higher3 主题
-
Algebraic-Roots-And-Indices Aqa Higher1 主题
-
Using-A-Calculator Aqa Higher1 主题
-
Surds Aqa Higher2 主题
-
Rounding-Estimation-And-Bounds Aqa Higher2 主题
-
Fractions-Decimals-And-Percentages Aqa Higher3 主题
-
Introduction Aqa Higher7 主题
-
Simple-And-Compound-Interest-Growth-And-Decay Aqa Higher4 主题
-
Percentages Aqa Higher3 主题
-
Fractions Aqa Higher4 主题
-
Powers-Roots-And-Standard-Form Aqa Higher4 主题
-
Prime-Factors-Hcf-And-Lcm Aqa Higher4 主题
-
Number-Operations Aqa Higher10 主题
-
Product-Rule-For-Counting Aqa Higher
-
Systematic-Lists Aqa Higher
-
Related-Calculations Aqa Higher
-
Multiplication-And-Division Aqa Higher
-
Addition-And-Subtraction Aqa Higher
-
Money-Calculations Aqa Higher
-
Negative-Numbers Aqa Higher
-
Irrational-Numbers Aqa Higher
-
Order-Of-Operations-Bidmas-Bodmas Aqa Higher
-
Mathematical-Symbols Aqa Higher
-
Product-Rule-For-Counting Aqa Higher
Speed-Time-Graphs Aqa Higher
Exam code:8300
Speed-time graphs
How do I use a speed-time graph?
-
Kinematics is the study of motion of objects
-
It looks at how an object moves over time
-
-
Speed-time graphs show the speed of an object at different times
-
Speed is on the vertical axis
-
Time is on the horizontal axis
-
-
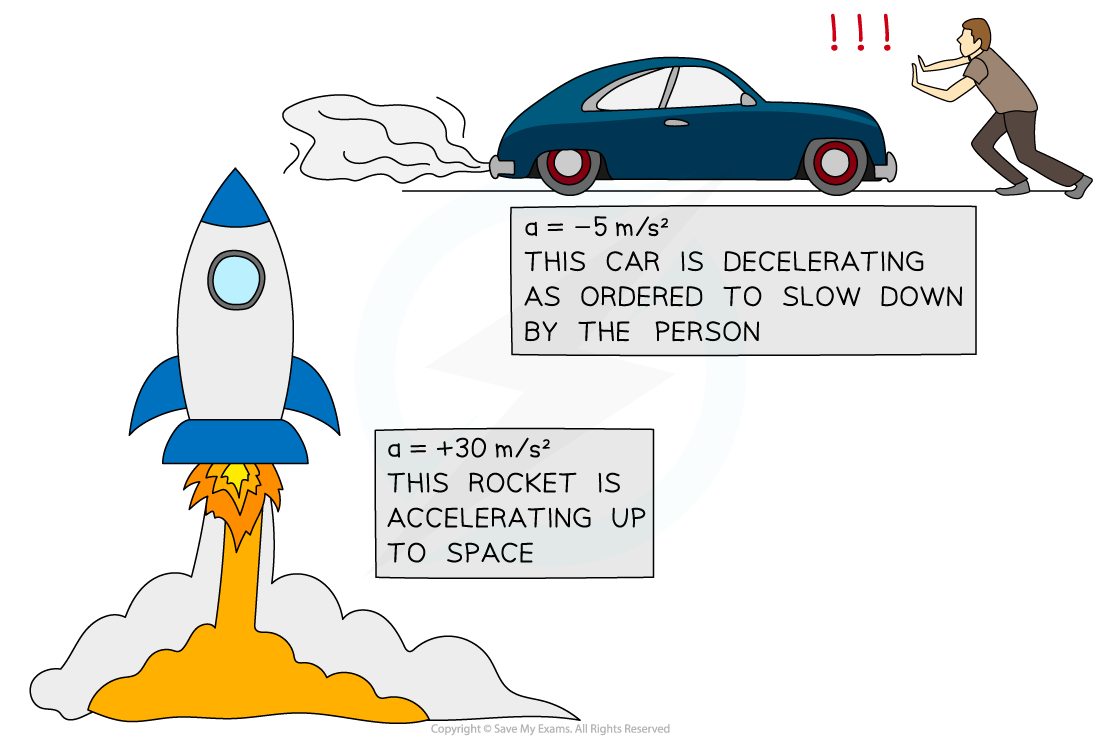
The gradient of the graph is the acceleration
-
-
A positive gradient shows positive acceleration (speeding up)
-
A negative gradient shows negative acceleration, (slowing down)
-
This is also called deceleration
-
-
Horizontal lines indicate moving at a constant speed
-
The object is neither speeding up or slowing down
-
If the constant speed is zero, then it is at rest
-
-
A straight line shows constant acceleration
-
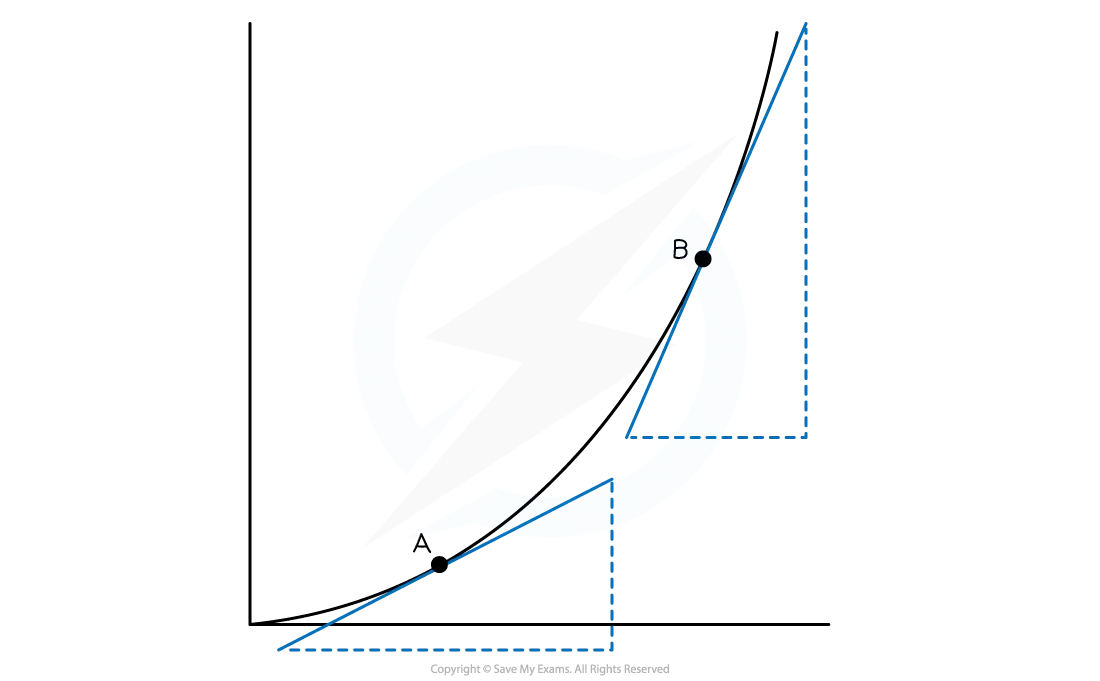
A curve shows changing acceleration
-
To find the acceleration at a particular point on the graph
-
draw a tangent to the graph at this point and find its gradient
-
-
-
The distance covered by the object is the area under the graph
-
Split the area into simple shapes, e.g. rectangles and triangles
-
Find the area of each shape and add them together
-
Examiner Tips and Tricks
-
Always check the vertical axis to see if you are given a speed-time graph or a distance-time graph!
Worked Example
The speed-time graph for a car travelling between two sets of traffic lights is shown below.
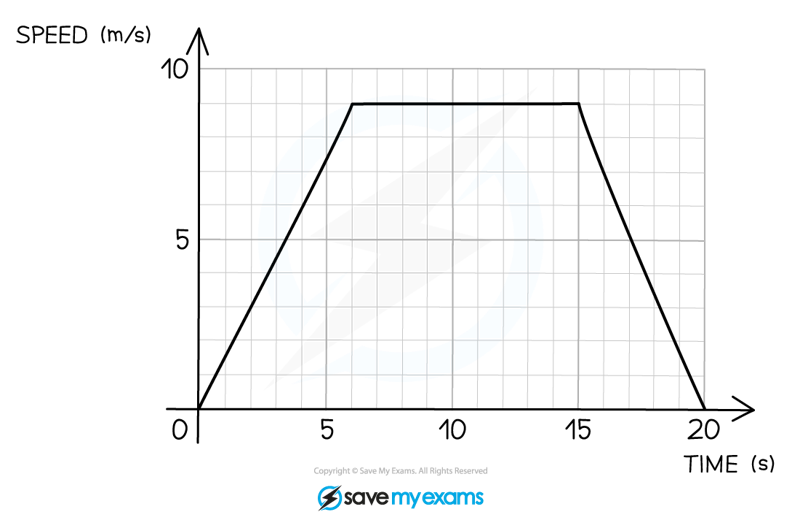
(a) For how long was the car travelling at a constant speed?
Constant speed is represented by horizontal lines
There is a horizontal line from 6 seconds to 15 seconds
15 – 6 = 9
9 seconds
(b) Calculate the acceleration during the first 6 seconds.
In a speed-time graph the acceleration is the gradient of the graph
![]()
Responses