
Maths Gcse Aqa Higher
-
Scatter-Graphs-And-Correlation Aqa Higher2 主题
-
Cumulative-Frequency-And-Box-Plots Aqa Higher4 主题
-
Histograms Aqa Higher3 主题
-
Statistical-Diagrams Aqa Higher5 主题
-
Averages-Ranges-And-Data Aqa Higher7 主题
-
Combined-And-Conditional-Probability Aqa Higher3 主题
-
Tree-Diagrams Aqa Higher1 主题
-
Simple-Probability-Diagrams Aqa Higher3 主题
-
Transformations Aqa Higher5 主题
-
Vectors Aqa Higher6 主题
-
3D-Pythagoras-And-Trigonometry Aqa Higher1 主题
-
Sine-Cosine-Rule-And-Area-Of-Triangles Aqa Higher4 主题
-
Pythagoras-And-Trigonometry Aqa Higher4 主题
-
Area-And-Volume-Of-Similar-Shapes Aqa Higher1 主题
-
Congruence-Similarity-And-Geometrical-Proof Aqa Higher5 主题
-
Volume-And-Surface-Area Aqa Higher3 主题
-
Circles-Arcs-And-Sectors Aqa Higher2 主题
-
Area-And-Perimeter Aqa Higher4 主题
-
Circle-Theorems Aqa Higher7 主题
-
Bearings-Scale-Drawing-Constructions-And-Loci Aqa Higher5 主题
-
Angles-In-Polygons-And-Parallel-Lines Aqa Higher3 主题
-
Symmetry-And-Shapes Aqa Higher6 主题
-
Exchange-Rates-And-Best-Buys Aqa Higher2 主题
-
Standard-And-Compound-Units Aqa Higher5 主题
-
Direct-And-Inverse-Proportion Aqa Higher2 主题
-
Problem-Solving-With-Ratios Aqa Higher2 主题
-
Ratios Aqa Higher3 主题
-
Sequences Aqa Higher4 主题
-
Transformations-Of-Graphs Aqa Higher2 主题
-
Graphing-Inequalities Aqa Higher2 主题
-
Solving-Inequalities Aqa Higher2 主题
-
Real-Life-Graphs Aqa Higher4 主题
-
Estimating-Gradients-And-Areas-Under-Graphs Aqa Higher2 主题
-
Equation-Of-A-Circle Aqa Higher2 主题
-
Functions Aqa Higher3 主题
-
Forming-And-Solving-Equations Aqa Higher3 主题
-
Graphs-Of-Functions Aqa Higher6 主题
-
Linear-Graphs Aqa Higher4 主题
-
Coordinate-Geometry Aqa Higher4 主题
-
Iteration Aqa Higher1 主题
-
Simultaneous-Equations Aqa Higher2 主题
-
Quadratic-Equations Aqa Higher4 主题
-
Linear-Equations Aqa Higher1 主题
-
Algebraic-Proof Aqa Higher1 主题
-
Rearranging-Formulas Aqa Higher2 主题
-
Algebraic-Fractions Aqa Higher4 主题
-
Completing-The-Square Aqa Higher1 主题
-
Factorising Aqa Higher6 主题
-
Expanding-Brackets Aqa Higher3 主题
-
Algebraic-Roots-And-Indices Aqa Higher1 主题
-
Using-A-Calculator Aqa Higher1 主题
-
Surds Aqa Higher2 主题
-
Rounding-Estimation-And-Bounds Aqa Higher2 主题
-
Fractions-Decimals-And-Percentages Aqa Higher3 主题
-
Introduction Aqa Higher7 主题
-
Simple-And-Compound-Interest-Growth-And-Decay Aqa Higher4 主题
-
Percentages Aqa Higher3 主题
-
Fractions Aqa Higher4 主题
-
Powers-Roots-And-Standard-Form Aqa Higher4 主题
-
Prime-Factors-Hcf-And-Lcm Aqa Higher4 主题
-
Number-Operations Aqa Higher10 主题
-
Product-Rule-For-Counting Aqa Higher
-
Systematic-Lists Aqa Higher
-
Related-Calculations Aqa Higher
-
Multiplication-And-Division Aqa Higher
-
Addition-And-Subtraction Aqa Higher
-
Money-Calculations Aqa Higher
-
Negative-Numbers Aqa Higher
-
Irrational-Numbers Aqa Higher
-
Order-Of-Operations-Bidmas-Bodmas Aqa Higher
-
Mathematical-Symbols Aqa Higher
-
Product-Rule-For-Counting Aqa Higher
Conversion-Graphs Aqa Higher
Exam code:8300
Conversion graphs
What is a conversion graph?
-
A conversion graph is a straight-line graph relating two quantities
-
You can convert (change) between them by reading values off the graph
-
-
Common examples include
-
Temperature
-
degrees Celsius (°C) and degrees Fahrenheit (°F)
-
-
Currency
-
Dollars ($) and Yen (¥)
-
-
Volume
-
Litres and gallons
-
-
Prices
-
A taxi driver charging per kilometre driven
-
-
-
The gradient of a conversion graph represents the rate of change
-
If the y-axis is the cost of a taxi journey (£) and the x-axis is the distance travelled (mile) then the gradient represents the cost per mile
-
A gradient of 5 means the cost increases by £5 for each mile travelled
-
-
How do I use a conversion graph?
-
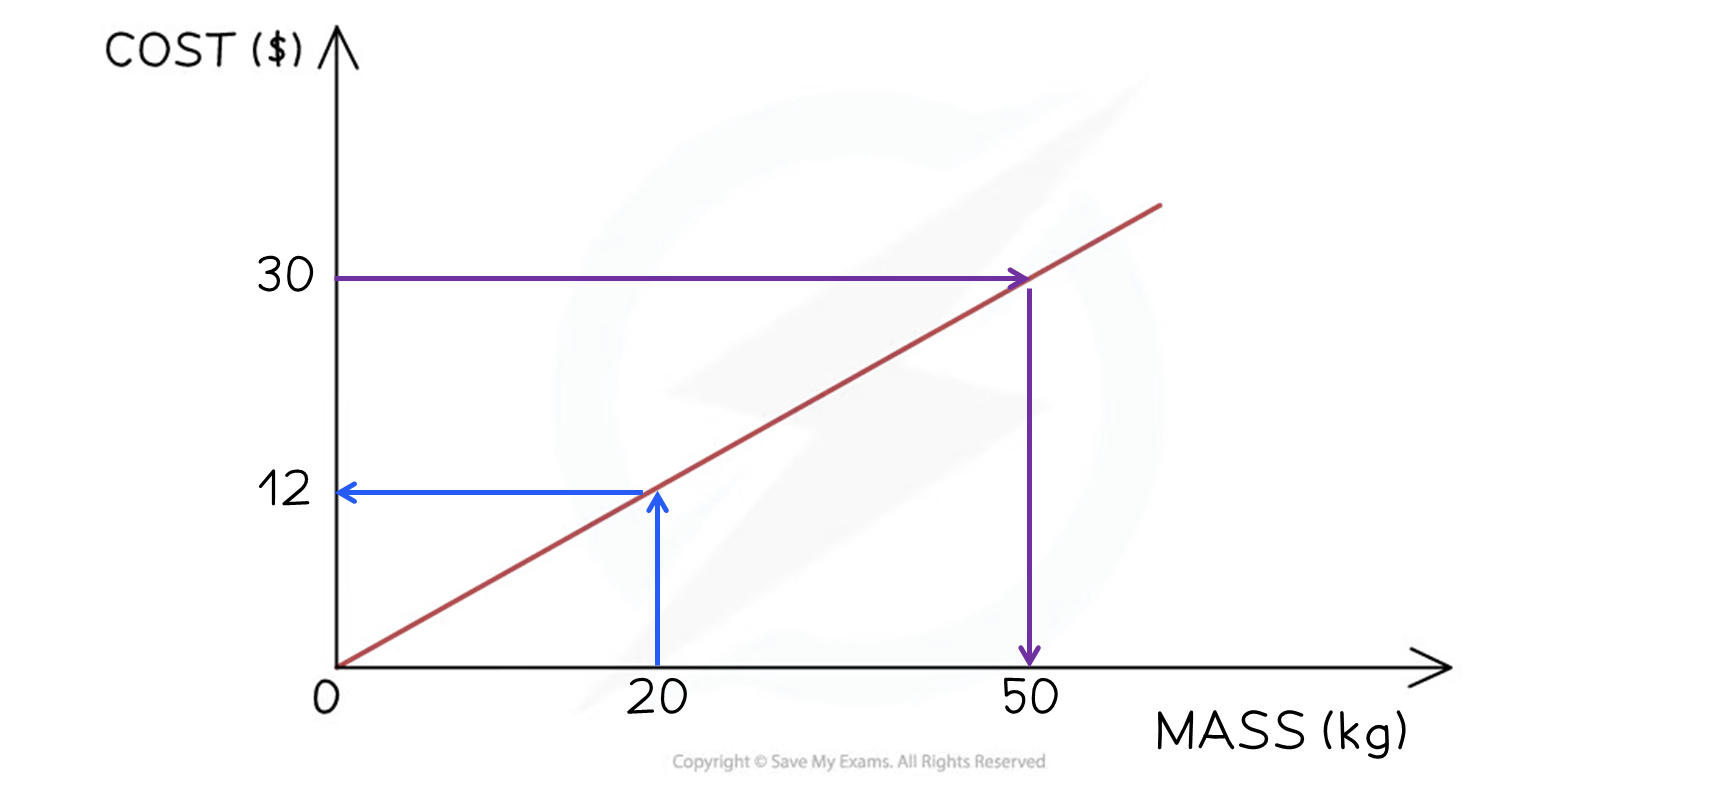
Find the cost of 20kg using the conversion graph below
-
Start at 20kg on the x-axis
-
Draw a vertical line to the graph
-
Then a horizontal line across to the y-axis
-
Read off the value
-
$12
-
-
-
Find how many kilograms can be bought with $30
-
Start at $30 on the y-axis
-
Draw a horizontal line to the graph
-
Then a vertical line down to the x-axis
-
Read off the value
-
50kg
-
-
-
You can use proportion to find values that on not on the axes
-
To find the cost of 120kg
-
120kg = 6 × 20kg costs 6 × $12 = $72
-
120kg = 50kg + 50kg + 20kg costs $30 + $30 + $12 = $72
-
-
You can only do this if the graph starts at the origin
-
How do I use a conversion graph that does not start at the origin?
-
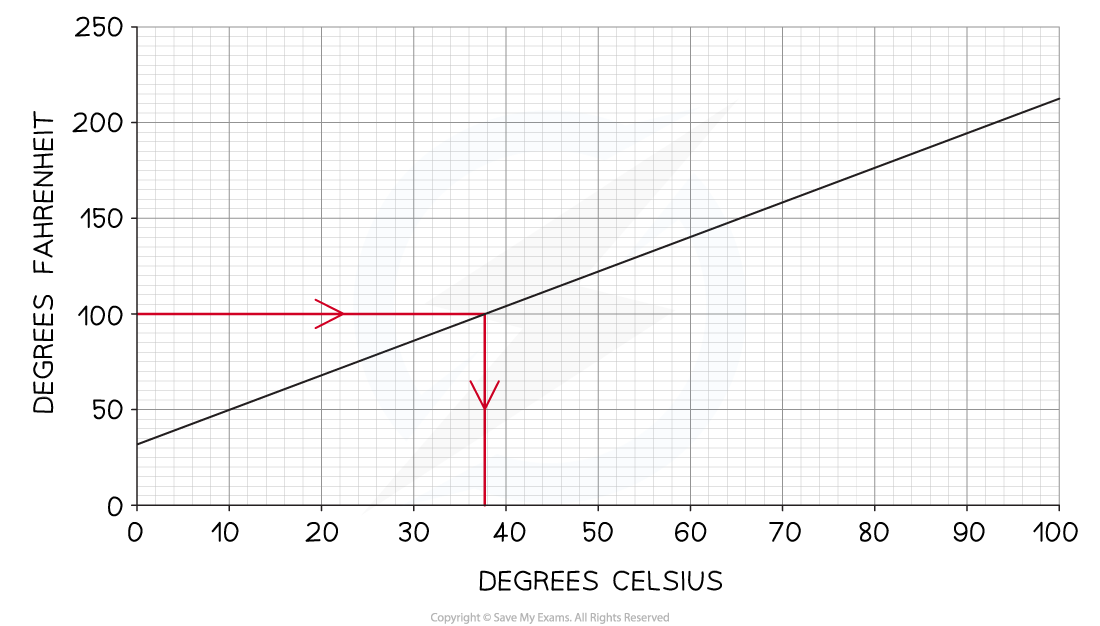
Convert 100°F into Celsius using the conversion graph below
-
Start at 100°F on the y-axis
-
Draw a horizontal line to the graph
-
Then a vertical line down to the x-axis
-
Read off the value
-
format('truetype')%3Bfont-weight%3Anormal%3Bfont-style%3Anormal%3B%7Dtext%7Bfill%3A%23000000%3B%3C%2Fstyle%3E%3C%2Fdefs%3E%3Ctext%20font-family%3D%22math1e551d3ddbf87bddac369765bd5%22%20font-size%3D%2216%22%20text-anchor%3D%22middle%22%20x%3D%228.5%22%20y%3D%2216%22%3E%26%23x2248%3B%3C%2Ftext%3E%3C%2Fsvg%3E) 37.5°C
37.5°C -
Answers between 37°C and 38°C would be accepted
-
(The true answer is 37.8°C to 1 decimal place)
-
-
-
The graph starts at 32 on the y-axis
-
This means that 0°C is 32°F
-
This starting value sometimes represents a fixed cost when money is involved
-
It could represent the fixed charge for the cost of a taxi fare
-
-
-
To convert values that are not on the axis
-
You would need to find an equation for the straight-line
-
Examiner Tips and Tricks
-
Always check the scales of the axes!
Worked Example
The graph below shows the price (in dollars, $) charged by a plumber for the time spent (in hours) on a particular job.
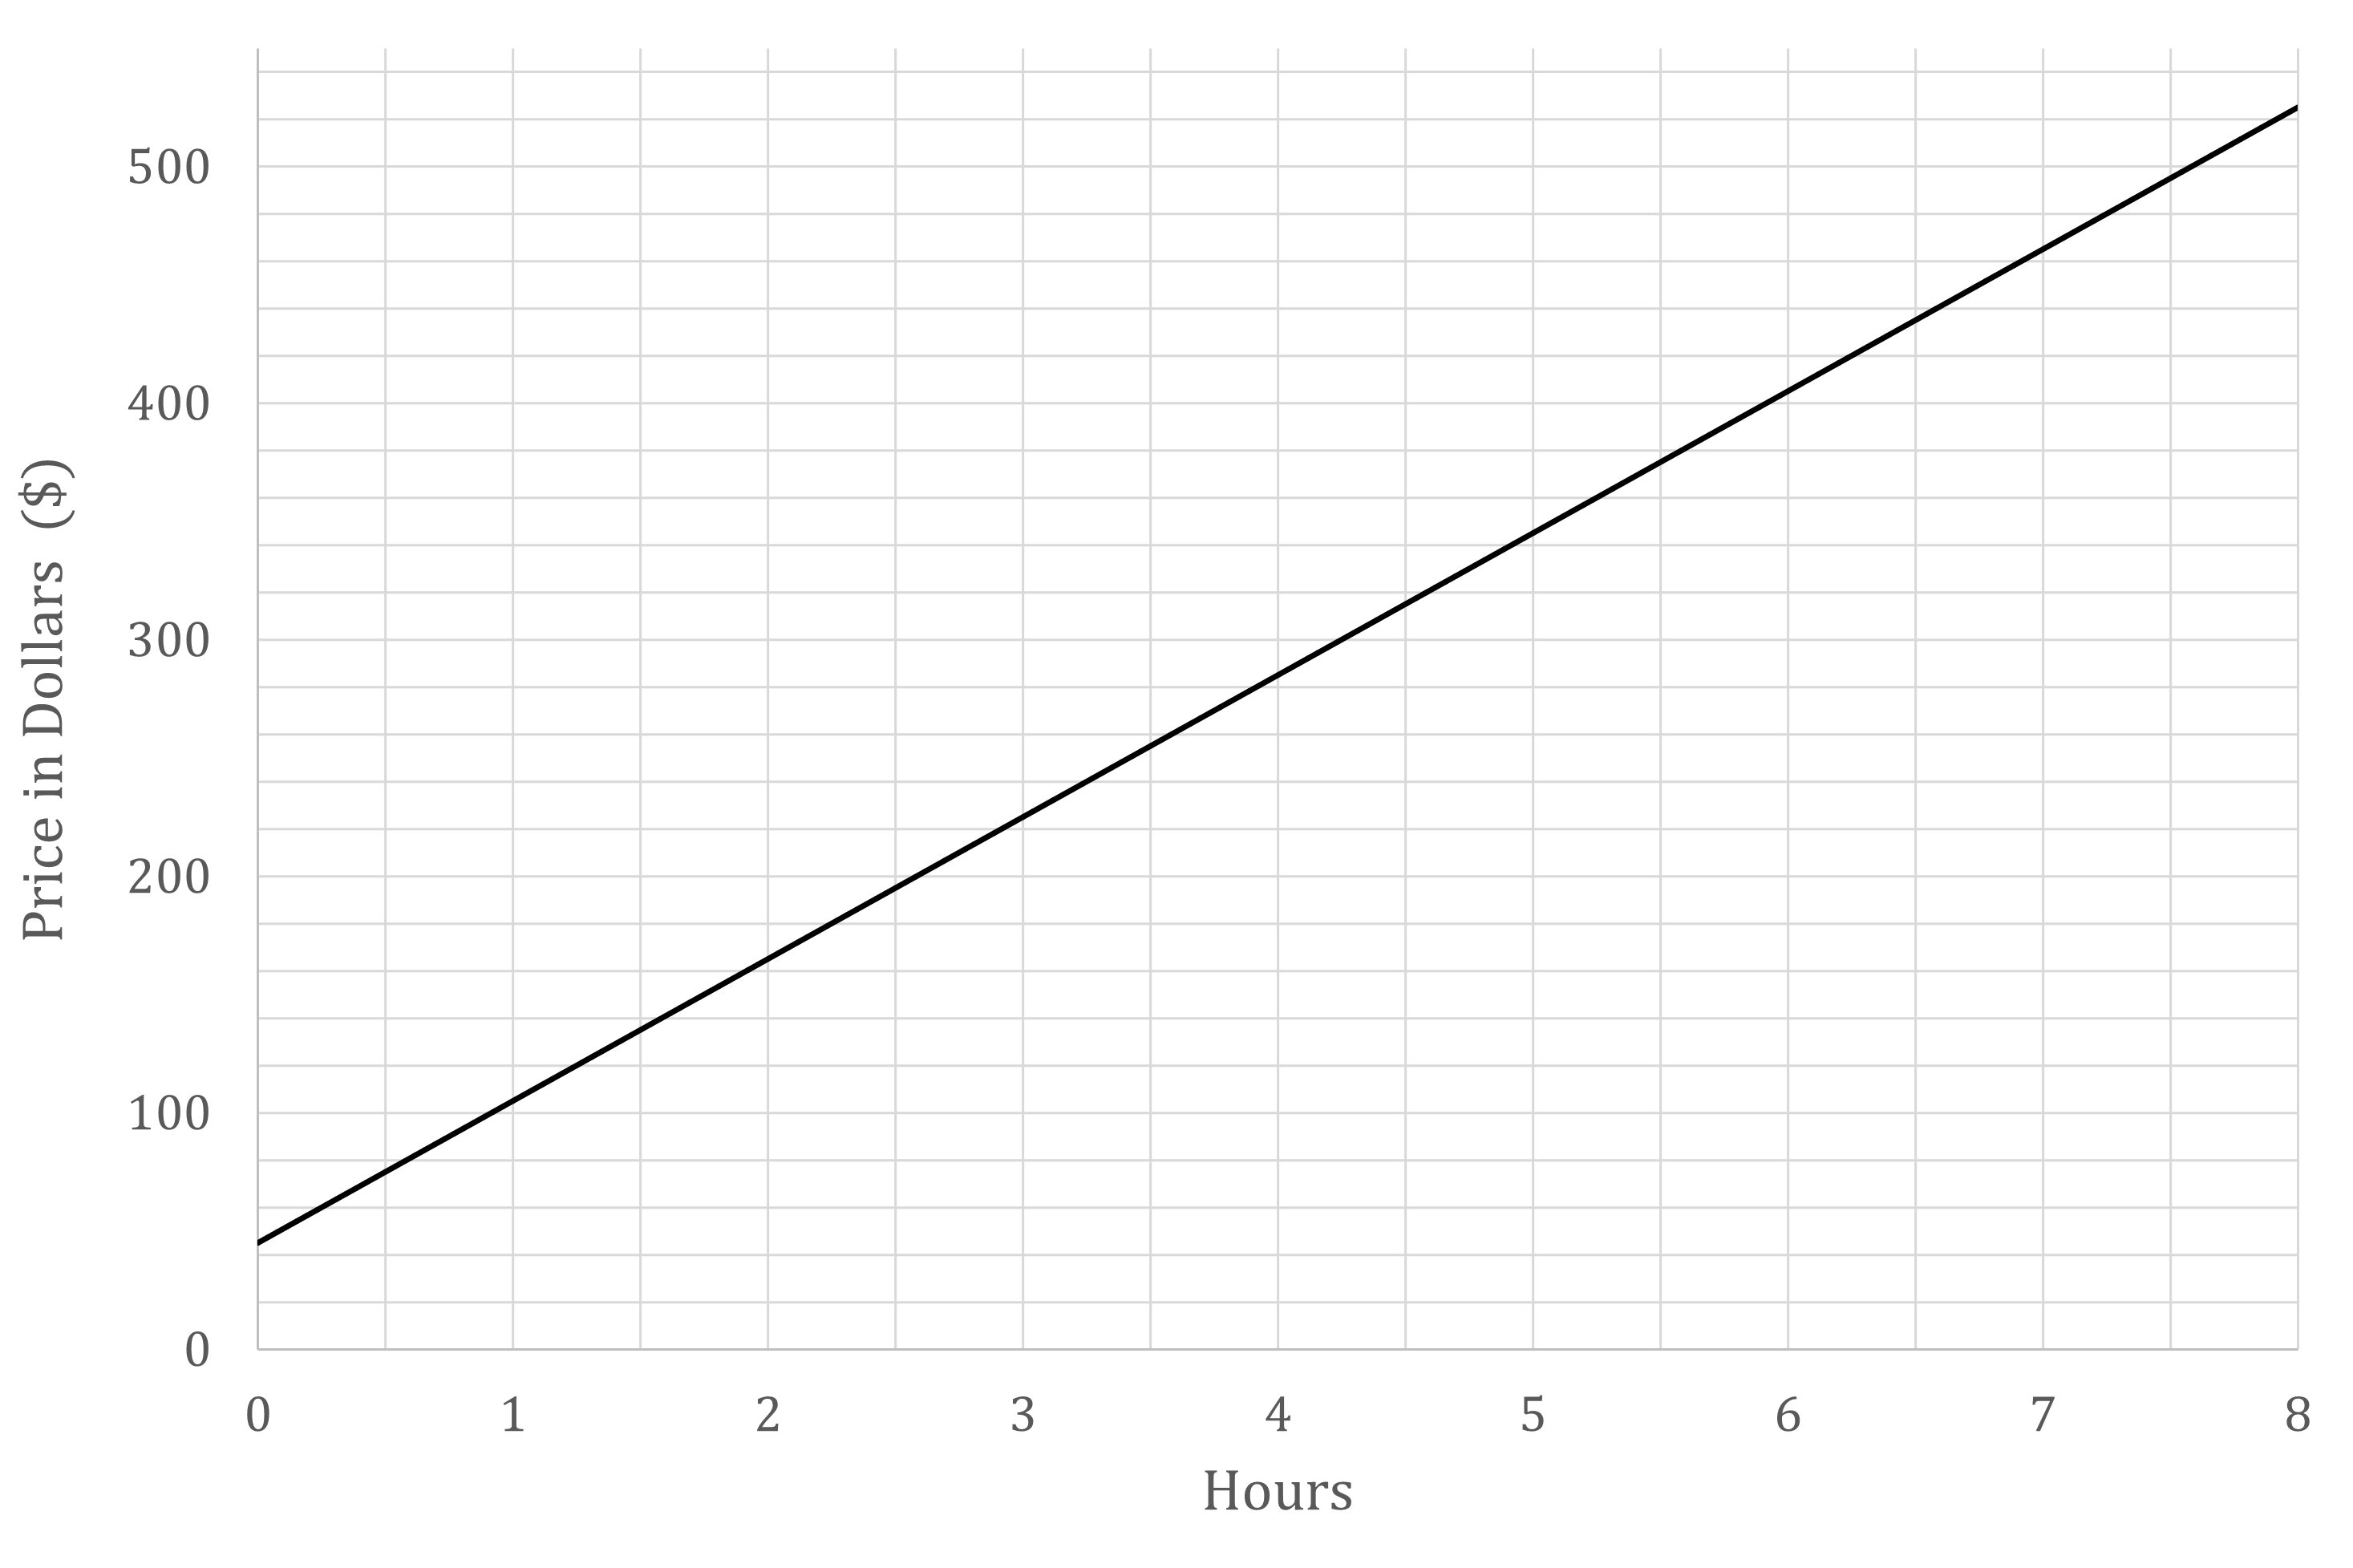
(a) Estimate the price charged for a job that takes 3 hours.
Draw a vertical line up from the x-axis at 3 hours
Then a horizontal line across to the y-axis
Read off the value
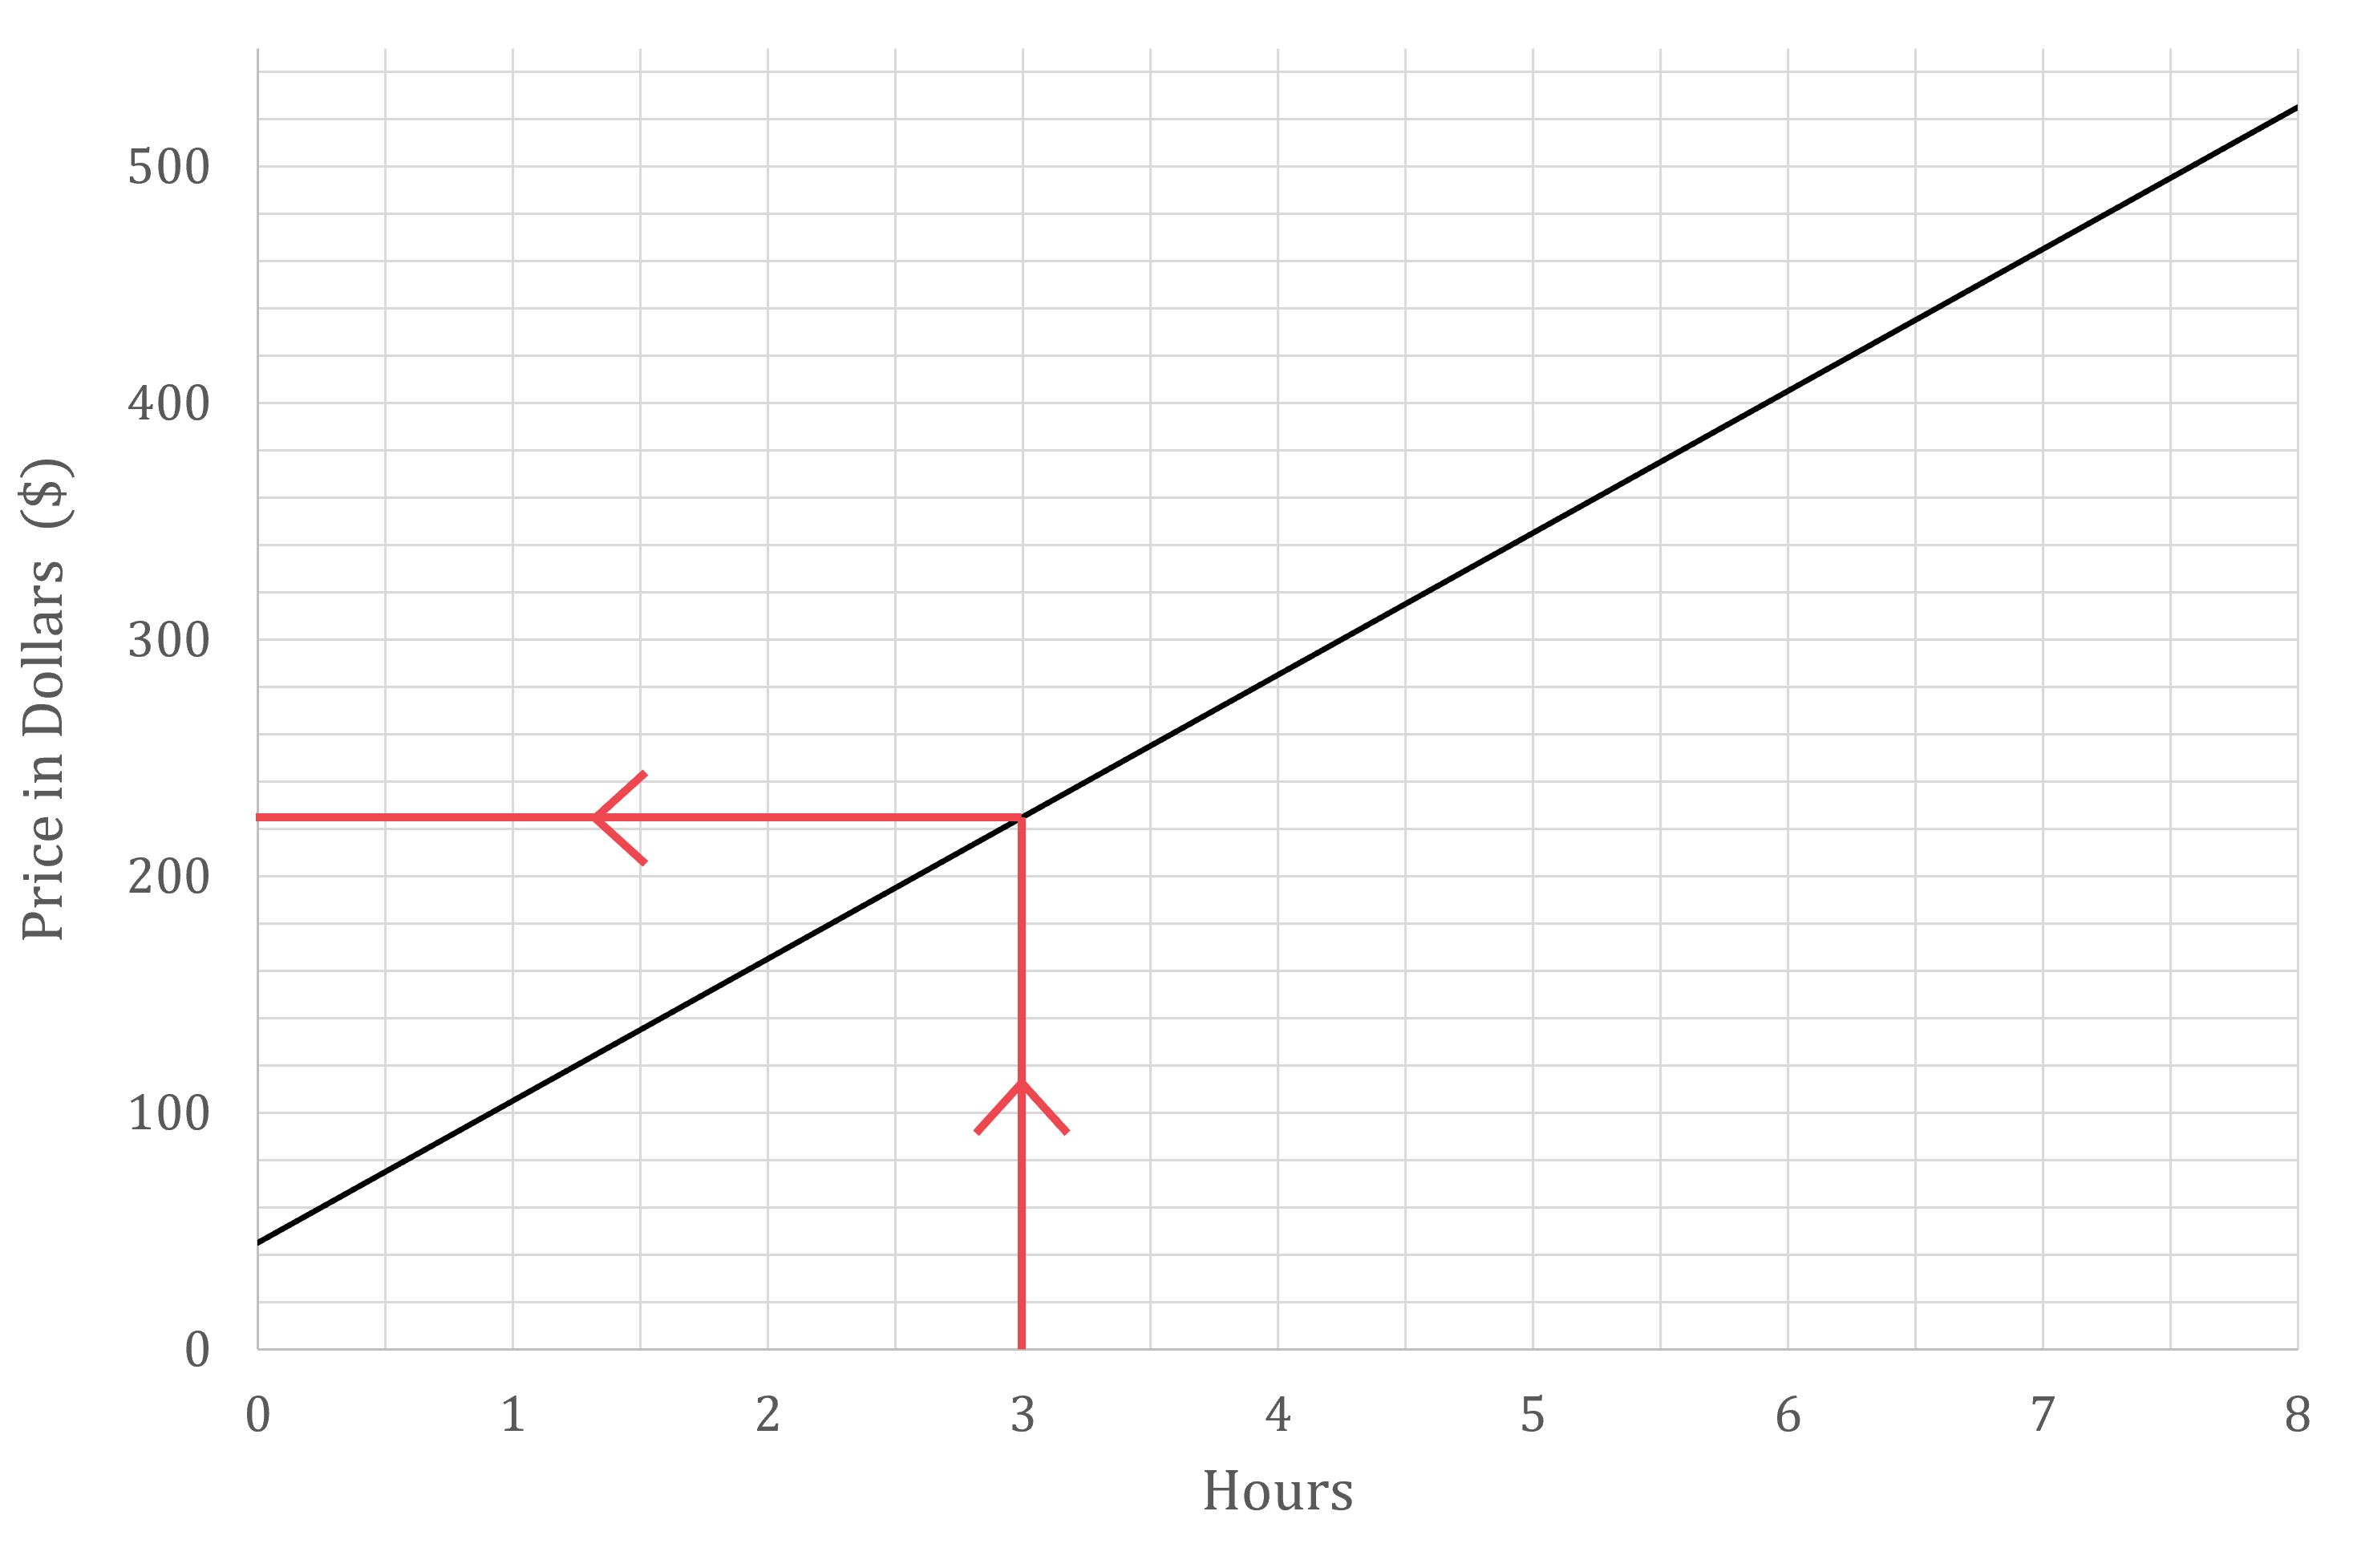
Approximately $225
Answers between $220 and £230 are accepted
(b) A particular job costs $320. Estimate, to the nearest half hour, how long this job took.
Draw a horizontal line across from the y-axis at $320
Draw a vertical line down to the x-axis
Read off the value to the nearest 0.5 hours
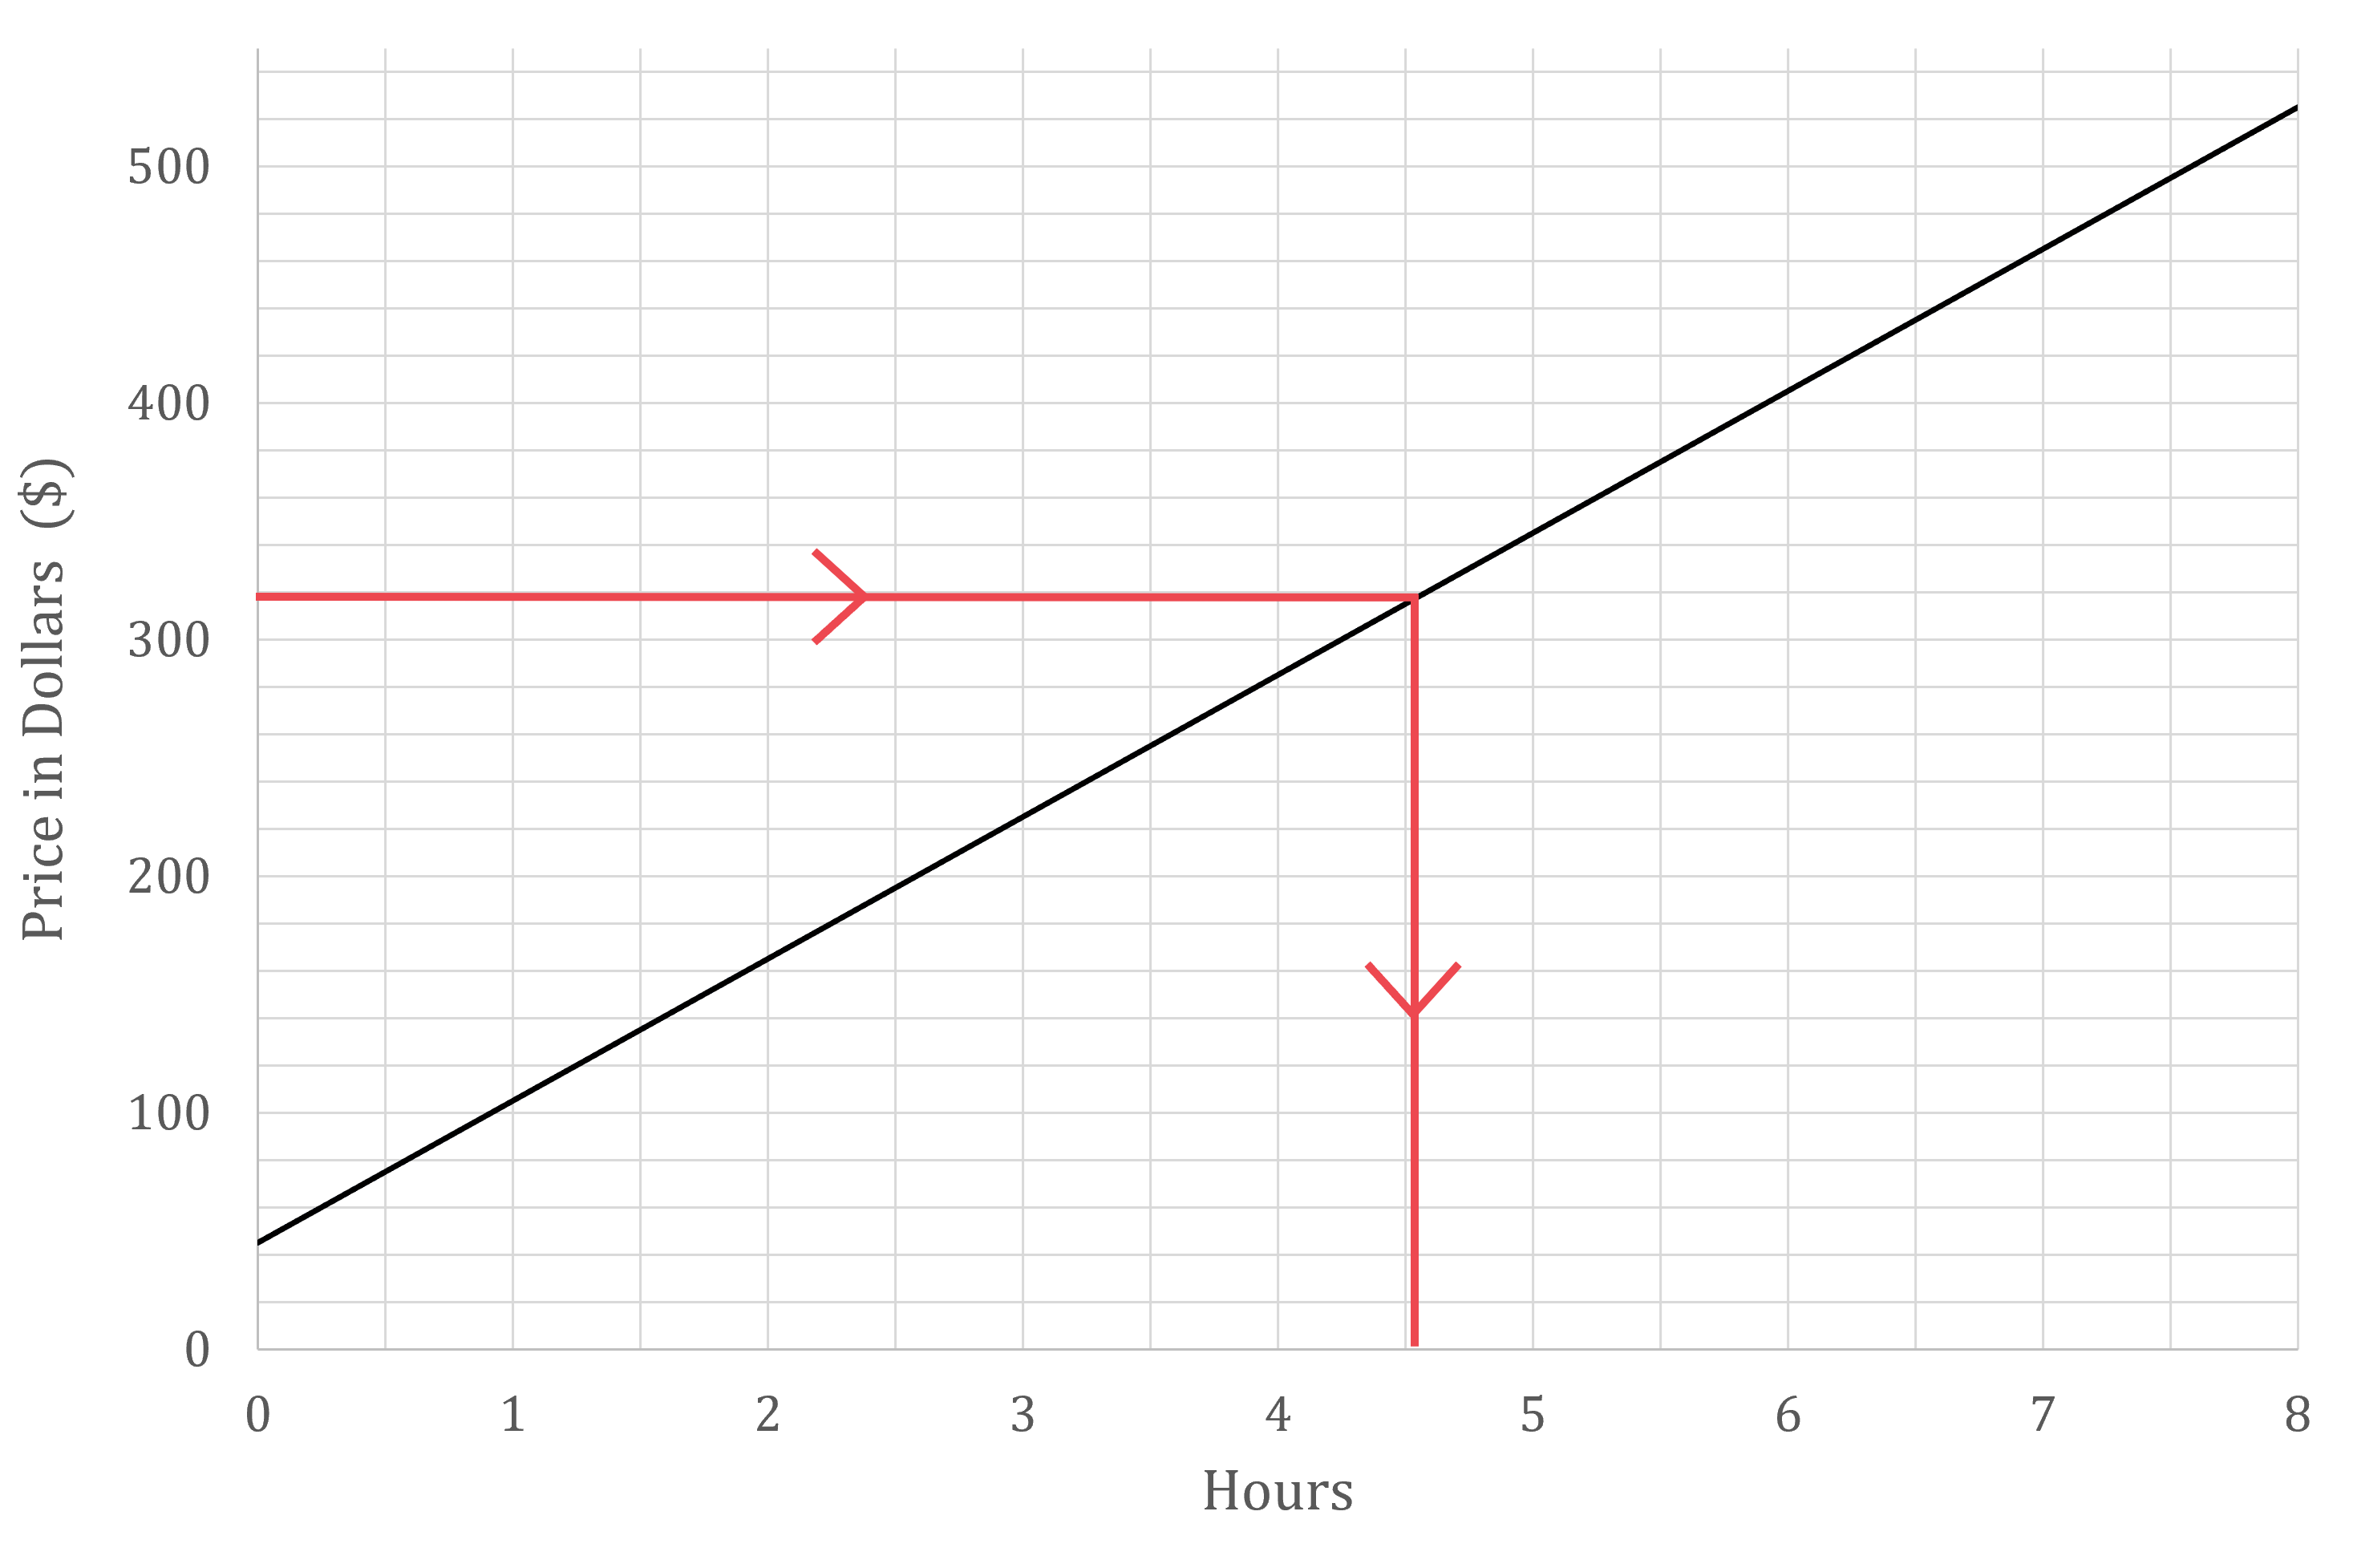
4.5 hours (to the nearest half hour)
(c) The plumber charges a fixed callout fee for travelling to the customer and inspecting the job before starting any work.
Find the price of the callout fee.
Before starting work means 0 hours of work has been done
Find the price charged for 0 hours
This is the y-intercept of the graph
Approximately $45
Answers between $40 and £50 are accepted
Responses