
Maths Gcse Aqa Higher
-
Scatter-Graphs-And-Correlation Aqa Higher2 主题
-
Cumulative-Frequency-And-Box-Plots Aqa Higher4 主题
-
Histograms Aqa Higher3 主题
-
Statistical-Diagrams Aqa Higher5 主题
-
Averages-Ranges-And-Data Aqa Higher7 主题
-
Combined-And-Conditional-Probability Aqa Higher3 主题
-
Tree-Diagrams Aqa Higher1 主题
-
Simple-Probability-Diagrams Aqa Higher3 主题
-
Transformations Aqa Higher5 主题
-
Vectors Aqa Higher6 主题
-
3D-Pythagoras-And-Trigonometry Aqa Higher1 主题
-
Sine-Cosine-Rule-And-Area-Of-Triangles Aqa Higher4 主题
-
Pythagoras-And-Trigonometry Aqa Higher4 主题
-
Area-And-Volume-Of-Similar-Shapes Aqa Higher1 主题
-
Congruence-Similarity-And-Geometrical-Proof Aqa Higher5 主题
-
Volume-And-Surface-Area Aqa Higher3 主题
-
Circles-Arcs-And-Sectors Aqa Higher2 主题
-
Area-And-Perimeter Aqa Higher4 主题
-
Circle-Theorems Aqa Higher7 主题
-
Bearings-Scale-Drawing-Constructions-And-Loci Aqa Higher5 主题
-
Angles-In-Polygons-And-Parallel-Lines Aqa Higher3 主题
-
Symmetry-And-Shapes Aqa Higher6 主题
-
Exchange-Rates-And-Best-Buys Aqa Higher2 主题
-
Standard-And-Compound-Units Aqa Higher5 主题
-
Direct-And-Inverse-Proportion Aqa Higher2 主题
-
Problem-Solving-With-Ratios Aqa Higher2 主题
-
Ratios Aqa Higher3 主题
-
Sequences Aqa Higher4 主题
-
Transformations-Of-Graphs Aqa Higher2 主题
-
Graphing-Inequalities Aqa Higher2 主题
-
Solving-Inequalities Aqa Higher2 主题
-
Real-Life-Graphs Aqa Higher4 主题
-
Estimating-Gradients-And-Areas-Under-Graphs Aqa Higher2 主题
-
Equation-Of-A-Circle Aqa Higher2 主题
-
Functions Aqa Higher3 主题
-
Forming-And-Solving-Equations Aqa Higher3 主题
-
Graphs-Of-Functions Aqa Higher6 主题
-
Linear-Graphs Aqa Higher4 主题
-
Coordinate-Geometry Aqa Higher4 主题
-
Iteration Aqa Higher1 主题
-
Simultaneous-Equations Aqa Higher2 主题
-
Quadratic-Equations Aqa Higher4 主题
-
Linear-Equations Aqa Higher1 主题
-
Algebraic-Proof Aqa Higher1 主题
-
Rearranging-Formulas Aqa Higher2 主题
-
Algebraic-Fractions Aqa Higher4 主题
-
Completing-The-Square Aqa Higher1 主题
-
Factorising Aqa Higher6 主题
-
Expanding-Brackets Aqa Higher3 主题
-
Algebraic-Roots-And-Indices Aqa Higher1 主题
-
Using-A-Calculator Aqa Higher1 主题
-
Surds Aqa Higher2 主题
-
Rounding-Estimation-And-Bounds Aqa Higher2 主题
-
Fractions-Decimals-And-Percentages Aqa Higher3 主题
-
Introduction Aqa Higher7 主题
-
Simple-And-Compound-Interest-Growth-And-Decay Aqa Higher4 主题
-
Percentages Aqa Higher3 主题
-
Fractions Aqa Higher4 主题
-
Powers-Roots-And-Standard-Form Aqa Higher4 主题
-
Prime-Factors-Hcf-And-Lcm Aqa Higher4 主题
-
Number-Operations Aqa Higher10 主题
-
Product-Rule-For-Counting Aqa Higher
-
Systematic-Lists Aqa Higher
-
Related-Calculations Aqa Higher
-
Multiplication-And-Division Aqa Higher
-
Addition-And-Subtraction Aqa Higher
-
Money-Calculations Aqa Higher
-
Negative-Numbers Aqa Higher
-
Irrational-Numbers Aqa Higher
-
Order-Of-Operations-Bidmas-Bodmas Aqa Higher
-
Mathematical-Symbols Aqa Higher
-
Product-Rule-For-Counting Aqa Higher
Finding-Areas-Under-Graphs Aqa Higher
Exam code:8300
Finding areas under graphs
How do I estimate the area under a graph?
-
To find an estimate for the area:
-
Split area into vertical strips
-
Draw straight lines between the tops of the strips
-
Find area of strips (trapeziums) using Area = ½(a + b)h
-
Add the areas
-
How do I know if my answer is an underestimate or an overestimate?
-
A common exam question is to ask if your estimate of the area is an underestimate or an overestimate
-
To answer this, simply look at the straight lines joining the tops of your strips
-
If the straight lines are below the curve, it is an underestimate
-
If the straight lines are above the curve, it is an overestimate
-
-
In your exam, the lines will all be below or all be above the curve- though it may be difficult to tell which for some strips
Examiner Tips and Tricks
-
This is particularly useful when working with speed-time and distance-time graphs if they are curves and not straight lines.
Worked Example
The graph below shows ![]() for
for ![]()
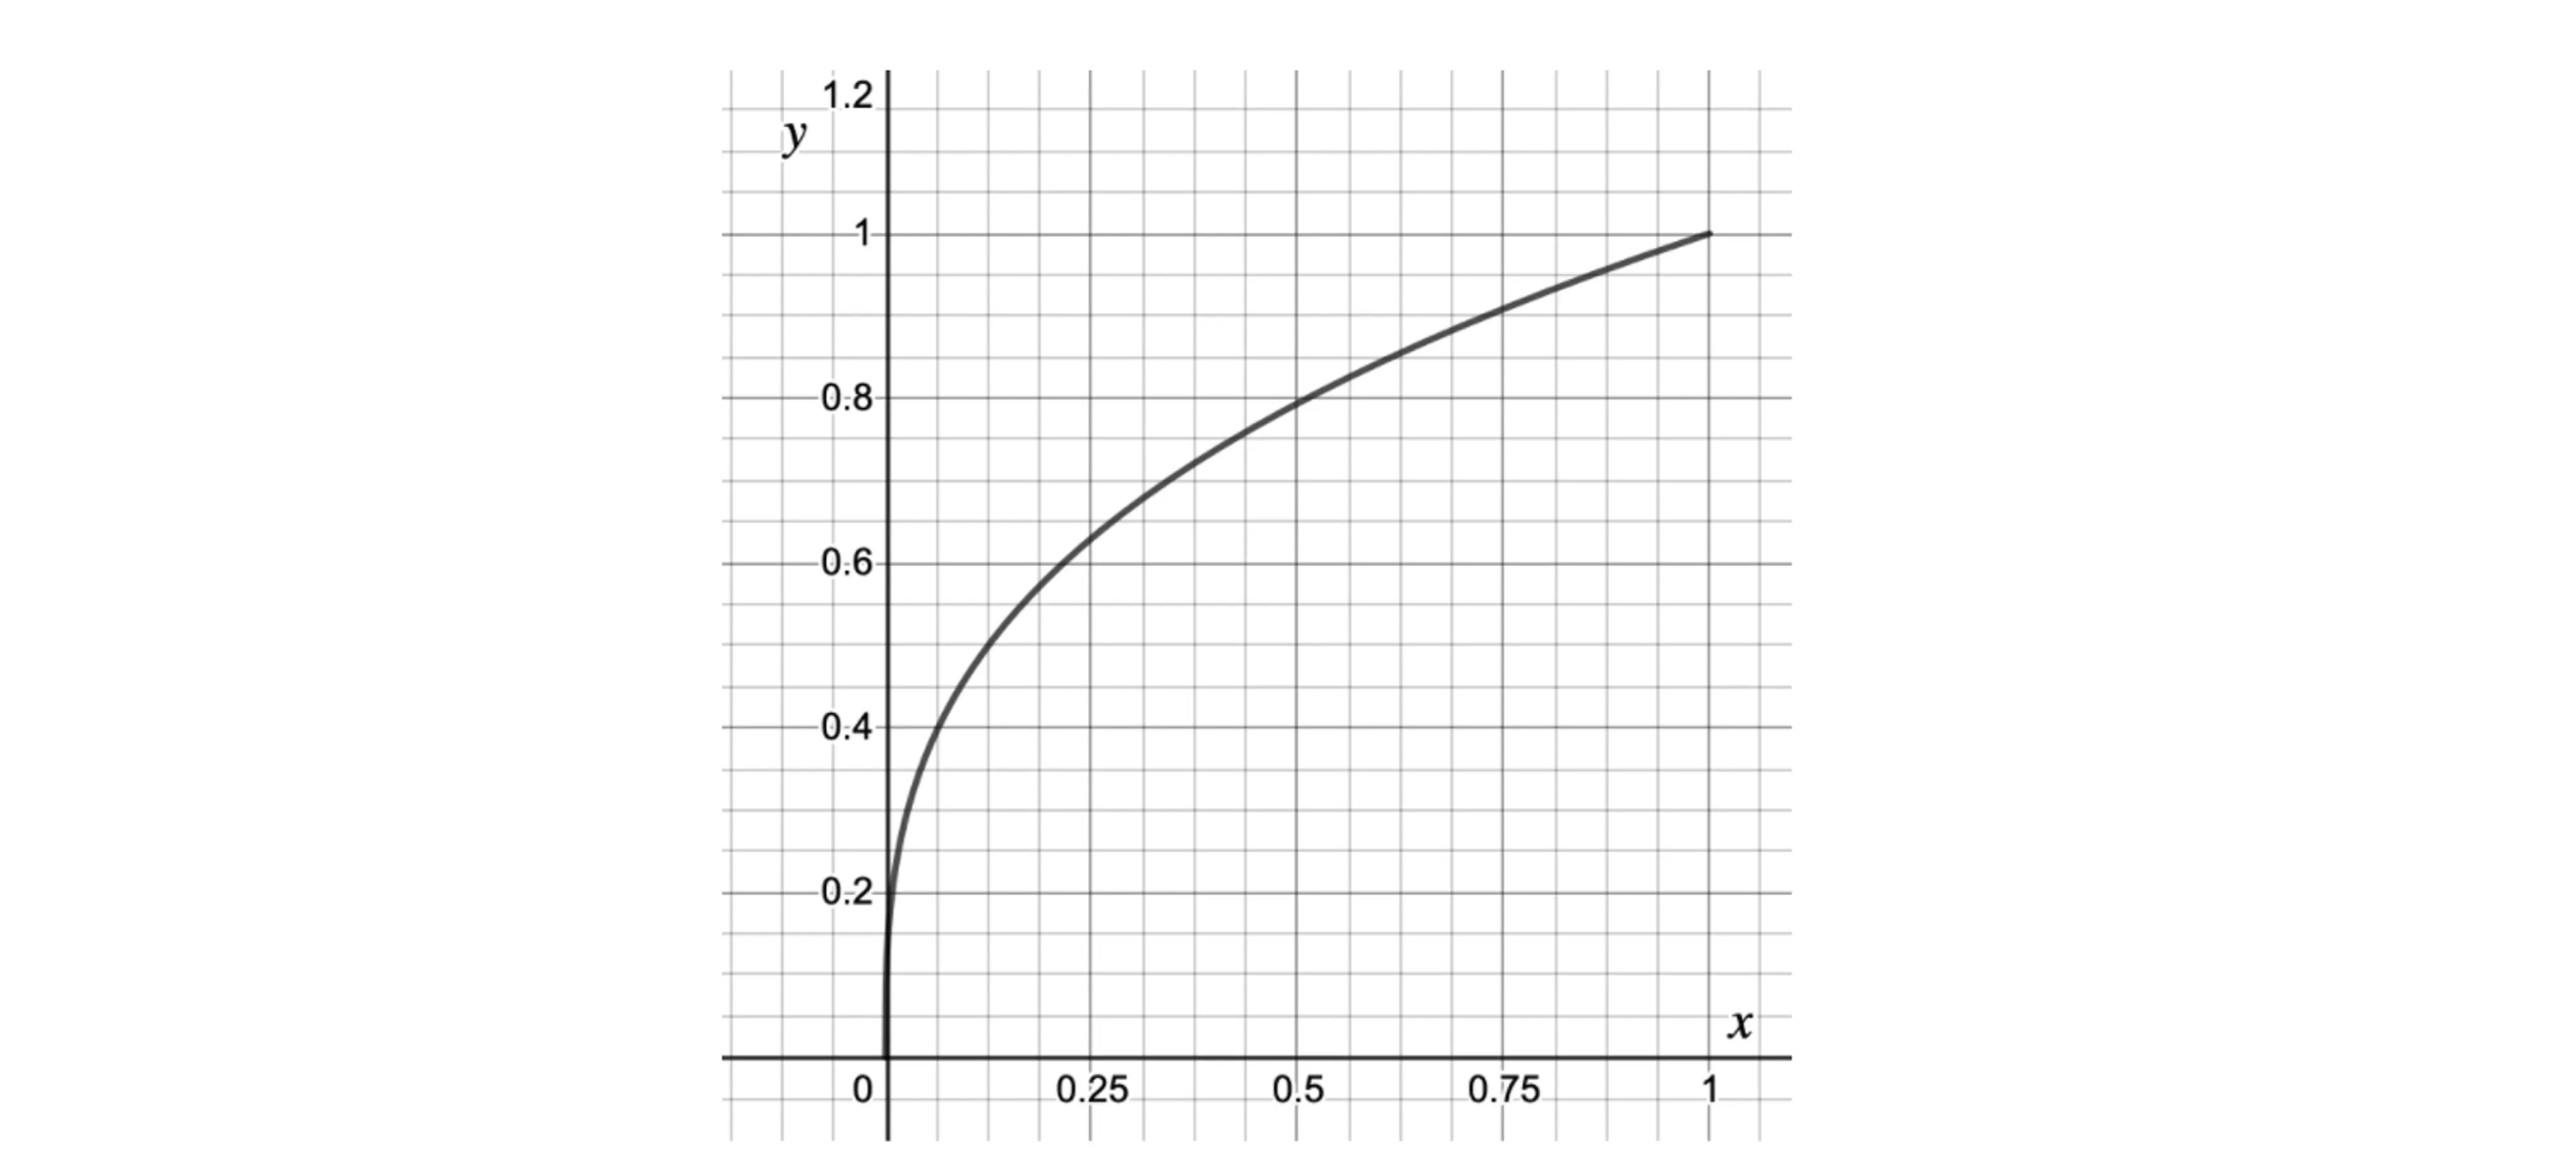
Find an estimate for the area between the curve, the ![]() axis and the line
axis and the line ![]() . Use four strips of equal width.
. Use four strips of equal width.
Split the area into four strips using the width of 0.25 for each one
Find the ![]() coordinate at the end of each strip by reading the value from the graph or substituting the <img alt=”x” data-mathml=”<math ><semantics><mi>x</mi><annotation encoding=”application/vnd.wiris.mtweb-params+json”>{“fontFamily”:”Times New Roman”,”fontSize”:”18″,”autoformat”:true,”toolbar”:”<toolbar ref=’general’><tab ref=’general’><removeItem ref=’setColor’/><removeItem ref=’bold’/><removeItem ref=’italic’/><removeItem ref=’autoItalic’/><removeItem ref=’setUnicode’/><removeItem ref=’mtext’ /><removeItem ref=’rtl’/><removeItem ref=’forceLigature’/><removeItem ref=’setFontFamily’ /><removeItem ref=’setFontSize’/></tab></toolbar>”}</annotation></semantics></math>” data-type=”commentary” height=”22″ role=”math” src=”data:image/svg+xml;charset=utf8,%3Csvg%20xmlns%3D%22http%3A%2F%2Fwww.w3.org%2F2000%2Fsvg%22%20xmlns%3Awrs%3D%22http%3A%2F%2Fwww.wiris.com%2Fxml%2Fmathml-extension%22%20height%3D%2222%22%20width%3D%2211%22%20wrs%3Abaseline%3D%2216%22%3E%3C!–MathML%3A%20%3Cmath%20xmlns%3D%22http%3A%2F%2Fwww.w3.org%2F1998%2FMath%2FMathML%22%3E%3Cmi%3Ex%3C%2Fmi%3E%3C%2Fmath%3E–%3E%3Cdefs%3E%3Cstyle%20type%3D%22text%2Fcss%22%2F%3E%3C%2Fdefs%3E%3Ctext%20font-family%3D%22Times%20New%20Roman%22%20font-size%3D%2218%22%20font-style%
coordinate at the end of each strip by reading the value from the graph or substituting the <img alt=”x” data-mathml=”<math ><semantics><mi>x</mi><annotation encoding=”application/vnd.wiris.mtweb-params+json”>{“fontFamily”:”Times New Roman”,”fontSize”:”18″,”autoformat”:true,”toolbar”:”<toolbar ref=’general’><tab ref=’general’><removeItem ref=’setColor’/><removeItem ref=’bold’/><removeItem ref=’italic’/><removeItem ref=’autoItalic’/><removeItem ref=’setUnicode’/><removeItem ref=’mtext’ /><removeItem ref=’rtl’/><removeItem ref=’forceLigature’/><removeItem ref=’setFontFamily’ /><removeItem ref=’setFontSize’/></tab></toolbar>”}</annotation></semantics></math>” data-type=”commentary” height=”22″ role=”math” src=”data:image/svg+xml;charset=utf8,%3Csvg%20xmlns%3D%22http%3A%2F%2Fwww.w3.org%2F2000%2Fsvg%22%20xmlns%3Awrs%3D%22http%3A%2F%2Fwww.wiris.com%2Fxml%2Fmathml-extension%22%20height%3D%2222%22%20width%3D%2211%22%20wrs%3Abaseline%3D%2216%22%3E%3C!–MathML%3A%20%3Cmath%20xmlns%3D%22http%3A%2F%2Fwww.w3.org%2F1998%2FMath%2FMathML%22%3E%3Cmi%3Ex%3C%2Fmi%3E%3C%2Fmath%3E–%3E%3Cdefs%3E%3Cstyle%20type%3D%22text%2Fcss%22%2F%3E%3C%2Fdefs%3E%3Ctext%20font-family%3D%22Times%20New%20Roman%22%20font-size%3D%2218%22%20font-style%
Responses