
Exam code:8291
Human Population Size & Composition
-
Population dynamics involve the study of how populations change in size and structure over time
-
Various changing factors, including birth rates, death rates, migration, and child mortality, contribute to the complexity of population dynamics
-
Understanding these components is essential for analysing the demographic characteristics of a population
Factors Influencing Population Size & Composition
-
Birth rate:
-
The number of live births per 1 000 people in a population during a given year
-
High birth rates contribute to population growth, while low birth rates may lead to population decline
-
-
Death rate:
-
The number of deaths per 1 000 in a population during a given year
-
High death rates can decrease population size, while low death rates contribute to population growth
-
-
Child mortality rate:
-
The number of deaths of children under 5 years old per 1 000 live births
-
High child mortality rates may result in a younger population due to a higher proportion of births needed to compensate for child deaths
-
-
Natural increase:
-
The difference between birth rates and death rates, excluding migration
-
Positive natural increase indicates population growth, while negative natural increase signifies a decline
-
-
Net migration (migration rate):
-
The difference between the number of immigrants and emigrants
-
Positive net migration contributes to population growth, while negative net migration can lead to decline
-
Dependency Ratio
-
Population structures and pyramids can be divided into three age-group categories, depending on level of economic activity
-
Young dependents – from 0-14 years, they rely on their economically active parents to support them
-
Economically active – from 15-64 years, they are the working population who earn income, pay taxes and contribute to the support of the young and elderly
-
Elderly dependents – from 65 years onwards, they are no longer economically active and so rely on support from the state and younger family members
-
-
The dependency ratio shows the relationship between a country’s working population (people who are economically active or independent) and non-working population (people who are economically inactive or dependent)
-
In other words, the dependency ratio is a way to measure the amount that the young and elderly people in a population depend on the economically active people in that population
-
Dependency ratio = ((young dependents + old dependents) ÷ economically active) × 100
Worked Example
A country has a total population of 200 000 people. There are:
-
50 000 children under the age of 15
-
110 000 people between the ages of 15 and 64
-
40 000 people aged 65 or older
What is the dependency ratio for this country?
Step 1: use the formula
Dependency ratio = ((young dependents + old dependents) ÷ economically active) × 100
Step 2: substitute in the known values
Dependency ratio = ((50 000 + 40 000) ÷ 110 000) × 100
= 0.82 x 100
= 82%
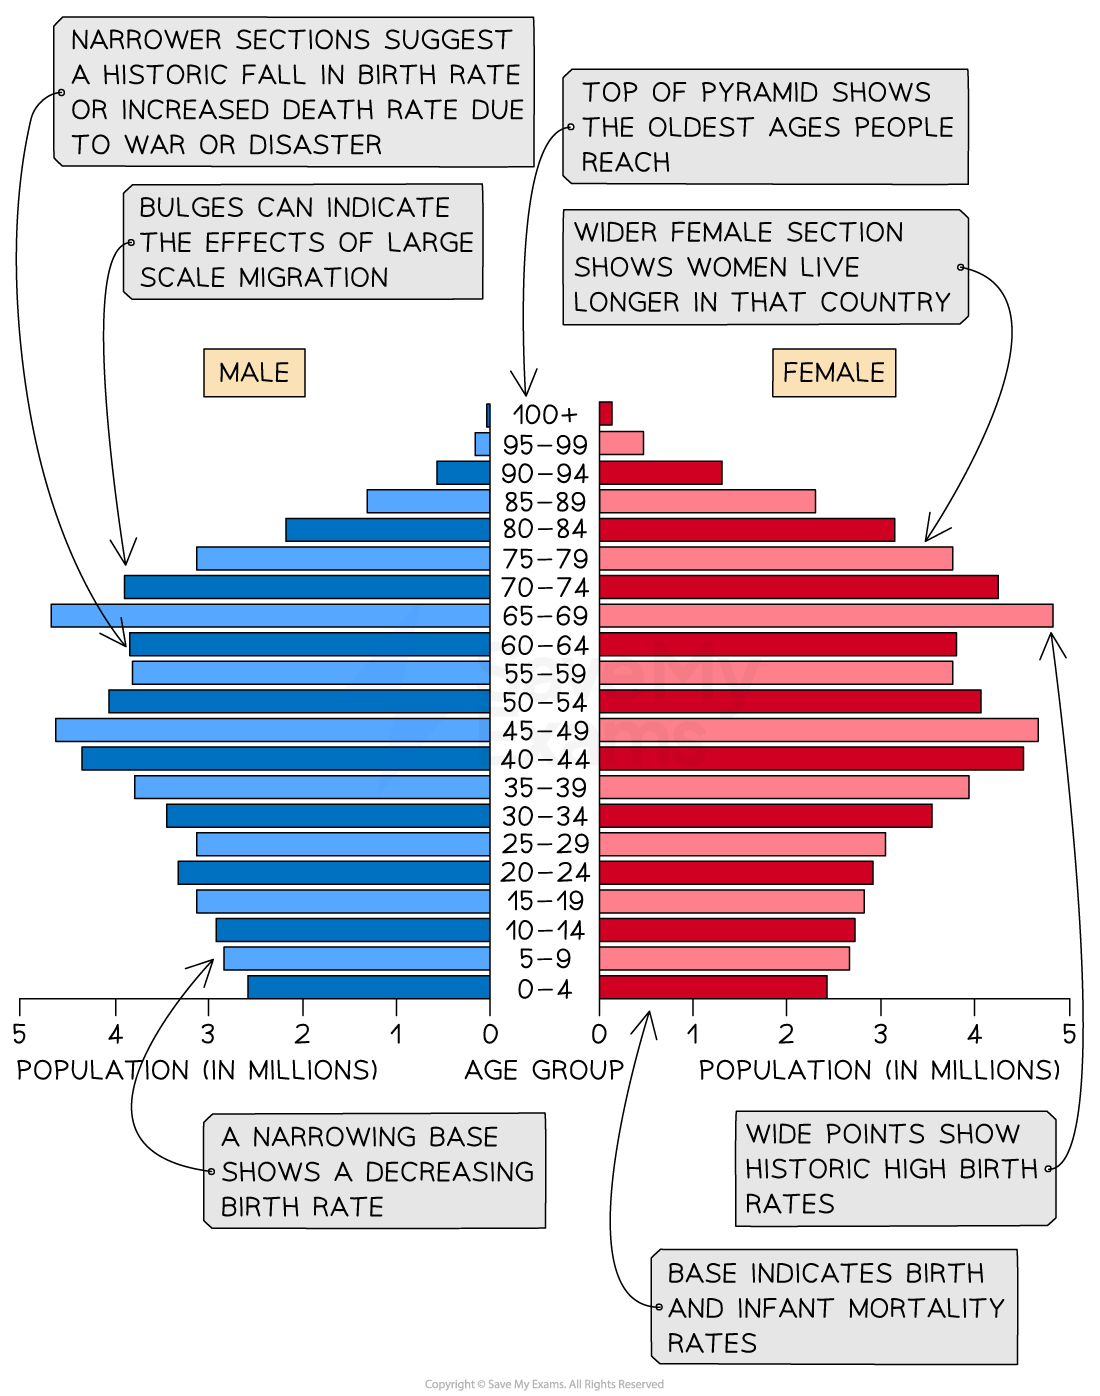
Population Pyramids
-
A population pyramid (also known as an age-gender pyramid, or sometimes referred to as an age structure diagram) is a graphical representation of a population’s age and gender structure
-
It displays the percentage or number of individuals in each age group and gender within a given population, typically a country or region
-
-
The population pyramid is usually represented as a horizontal bar graph, with the age groups displayed along the vertical axis, and the percentage or number of individuals in each age group displayed along the horizontal axis
-
The left side of the graph displays the male population, while the right side shows the female population
-
-
The shape of the population pyramid can provide insights into the demographic characteristics of a population
-
For instance, a pyramid with a broad base and a narrow top indicates a young population with high fertility rates and low life expectancy
-
Whereas a pyramid with a narrow base and a broad top indicates an ageing population with low fertility rates and high life expectancy
-
-
Population pyramids are widely used by demographers, economists, and policymakers to understand population trends, forecast future population growth, and plan for social and economic policies
-
They are also used in fields such as public health, education, and social welfare to plan for the needs of specific age groups within a population
-
This means that governments can estimate and plan for spending
-
-
As countries develop and pass through the stages of demographic transition, the shape of the population pyramid changes
-
A population pyramid can be used to identify the following groups:
-
Young dependents
-
Old dependents
-
Economically active (working population)
-
Dependency ratio
-
Population Structures of LICs and HICs

-
Low-income countries (LICs) like Niger typically have a concave pyramid shape
-
This indicates:
-
High birth rate
-
Low life expectancy
-
High death rate
-
High infant mortality rate
-
Young dependent population dominates
-

-
More developed LICs like Nepal typically have a pyramid shape with a taller base, like the one shown above
-
This indicates:
-
Decreasing birth rate
-
Increasing life expectancy
-
Decreasing death rate
-
Decreasing infant mortality
-
Decreasing young dependents and increasing economically active population
-

-
High-income countries (HICs) such as the USA typically have a column shape
-
This indicates:
-
Low birth rate
-
High life expectancy
-
Low death rate
-
Low infant mortality
-
Large working age population
-
Responses