
Exam code:8291
Observations & Hypotheses
-
The scientific method is a systematic approach used by scientists to investigate natural phenomena and acquire knowledge
-
Central to the method is the interplay between observations and the development, testing, and evaluation of hypotheses
-
-
Observations involve gathering information using the senses or scientific tools and instruments
-
Observations serve as a starting point, prompting scientists to explore and understand a particular phenomenon
-
-
Hypotheses are educated guesses or predictions that are formulated based on observations
-
Scientists use inductive reasoning to generate hypotheses from observed patterns or phenomena
-
-
Scientists continually refine their hypotheses through a cyclical process of observation and hypothesis formulation
-
Observations guide the formation of hypotheses, and hypotheses, in turn, prompt further observations
-
-
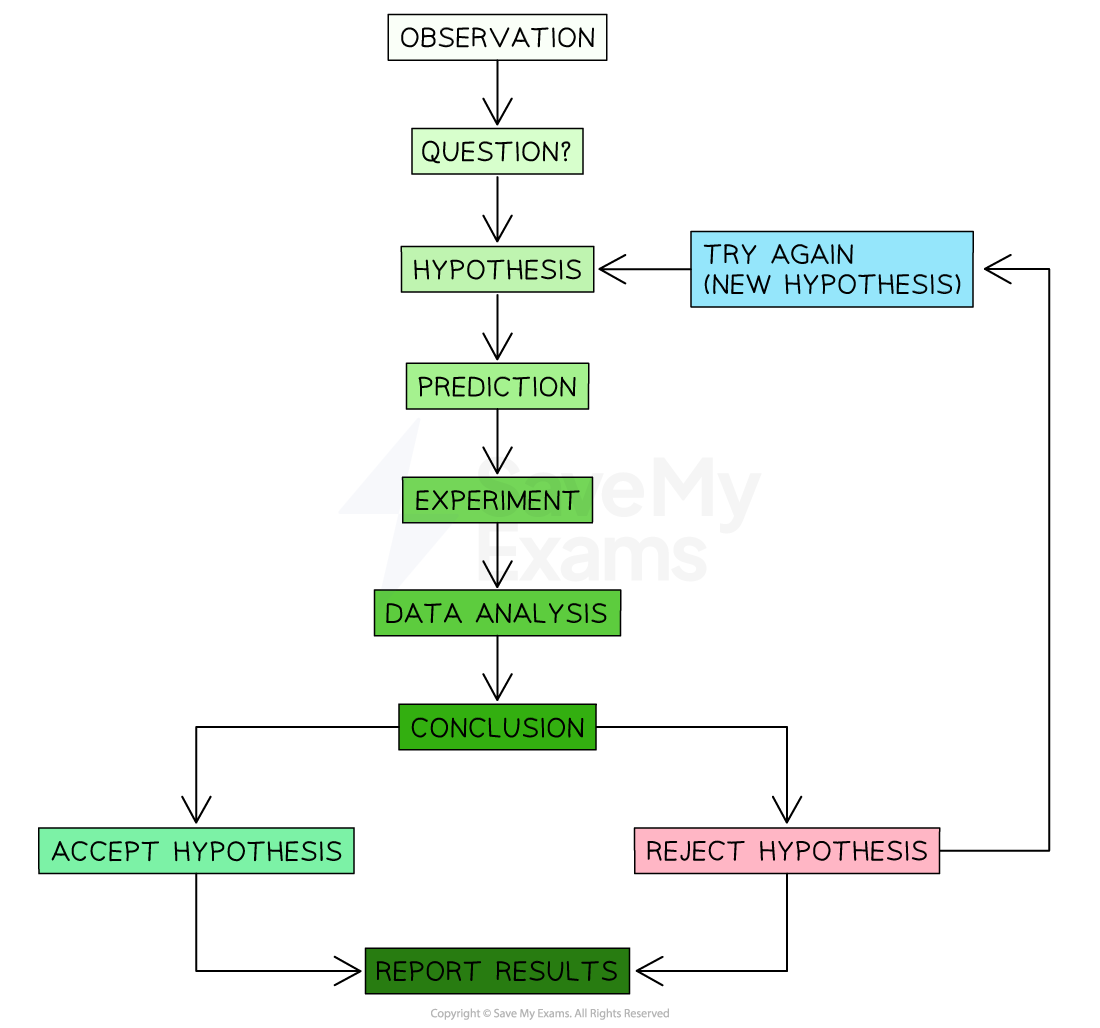
In summary, the main steps of the scientific method are:
-
Make an observation (or note a phenomenon in the natural world) that poses a problem or question
-
Develop a testable hypothesis based on the observed patterns or phenomena
-
Design an experiment that allows for controlled variables and quantitative data collection
-
Conduct the experiment and gather quantitative data to objectively measure the outcomes
-
Use statistical methods to analyse the collected data and draw meaningful conclusions
-
Make a conclusion by evaluating whether the results support or do not support the hypothesis, leading to a clearer understanding of the phenomenon
-
-
It is possible to apply the scientific method to design and conduct investigations focused on environmental issues, ensuring the collection of reliable environmental data
-
This data can be used to help further our understanding of environmental challenges and how to manage them
-
Testing a Hypothesis
-
When scientists want to explore and understand something, they conduct experiments to test their ideas
-
This process is known as hypothesis testing, a crucial step in the scientific method
-
-
In order for an experiment to produce valid quantitative data (that can then be analysed), there are certain types of variables that need to be understood and carefully managed
Variables
-
In an experiment, a variable is any factor that can change or be changed
-
There are different types of variables within an experiment
-
The independent variable: the only variable that should be changed throughout an experiment
-
The dependent variable: the variable that is measured to determine the outcome of an experiment (the results)
-
The controlled variables: any other variables that may affect the results of the experiment that need to be controlled (if possible) or monitored
-
-
It is essential that any variable that may affect the outcome of an experiment is controlled in order for the results to be valid and for the experiment to be considered a fair test
-
A fair test is one in which only the independent variable has been allowed to affect the dependent variable
-
Preliminary research and preliminary studies can be used to identify variables within an experiment and to determine ways of controlling these variables effectively
-
The existing published scientific research surrounding the question or problem being investigated is likely to contain information about different factors or variables that the person doing the experiment should be aware of
-
Examples of Independent and Dependent Variables
|
Experiment |
Independent Variable |
Dependent Variable |
Example of Control Group |
|---|---|---|---|
|
Impact of soil pH on plant growth |
Soil pH |
Height and health of the plants |
Plants in soil with a carefully maintained neutral pH |
|
Effect of temperature on fish behaviour |
Water temperature |
Fish swimming patterns and activity |
Fish in a controlled tank with a consistent, optimal temperature |
|
Influence of light intensity on photosynthesis |
Light intensity |
Rate of photosynthesis in plants |
Plants exposed to a controlled, consistent low light environment |
|
Study on air pollution impact on respiratory health |
Air pollution levels |
Respiratory health of study participants |
Individuals in an area with minimal air pollution exposure |
|
Biodiversity in response to habitat fragmentation |
Level of habitat fragmentation |
Diversity and abundance of species |
Ecosystem with undisturbed, unfragmented habitat |
|
Impact of fertiliser type on crop yield |
Type of fertiliser used |
Crop yield and quality |
Crops treated with a standardised, common fertiliser or no fertiliser |
-
The effect of temperature on photosynthesis can be investigated as shown in the diagram below
-
The plants usually used are Elodea or Cabomba – types of pondweed
-
As photosynthesis occurs, oxygen gas produced is released
-
As the plant is in water, the oxygen released can be seen as bubbles leaving the cut end of the pondweed
-
The number of bubbles produced over a minute can be counted to record the rate
-
The more bubbles produced per minute, the faster the rate of photosynthesis
-

Responses