
Economics_A-level_Edexcel
-
1-1-nature-of-economics6 主题
-
1-2-how-markets-work10 主题
-
1-3-market-failure4 主题
-
1-4-government-intervention2 主题
-
2-1-measures-of-economic-performance4 主题
-
2-2-aggregate-demand-ad5 主题
-
2-3-aggregate-supply-as3 主题
-
2-4-national-income4 主题
-
2-5-economic-growth4 主题
-
2-6-macroeconomic-objectives-policies4 主题
-
3-1-business-growth3 主题
-
3-2-business-objectives1 主题
-
3-3-revenues-costs-and-profits4 主题
-
3-4-market-structures7 主题
-
3-5-labour-market3 主题
-
3-6-government-intervention2 主题
-
4-1-international-economics9 主题
-
4-2-poverty-inequality2 主题
-
4-3-emerging-developing-economies3 主题
-
4-4-the-financial-sector3 主题
-
4-5-role-of-the-state-in-the-macroeconomy4 主题
-
5-1-the-exam-papers3 主题
-
5-2-economics-a-level-skills1 主题
-
5-3-structuring-your-responses9 主题
characteristics-of-as
The Aggregate Supply (AS) Curve
-
Aggregate supply is the total supply of goods/services produced within an economy at a specific price level at a given time

-
The SRAS curve is upward sloping due to two reasons
-
The aggregate supply is the combined supply of all individual supply curves in an economy which are also upward sloping
-
As real output increases, firms have to spend more to increase production e.g. wage bills will increase
-
Increased costs result in higher average prices
-
-
A movement along the SRAS curve
-
Whenever there is a change in the average price level (AP) in an economy, there is a movement along the short run aggregate supply (SRAS) curve
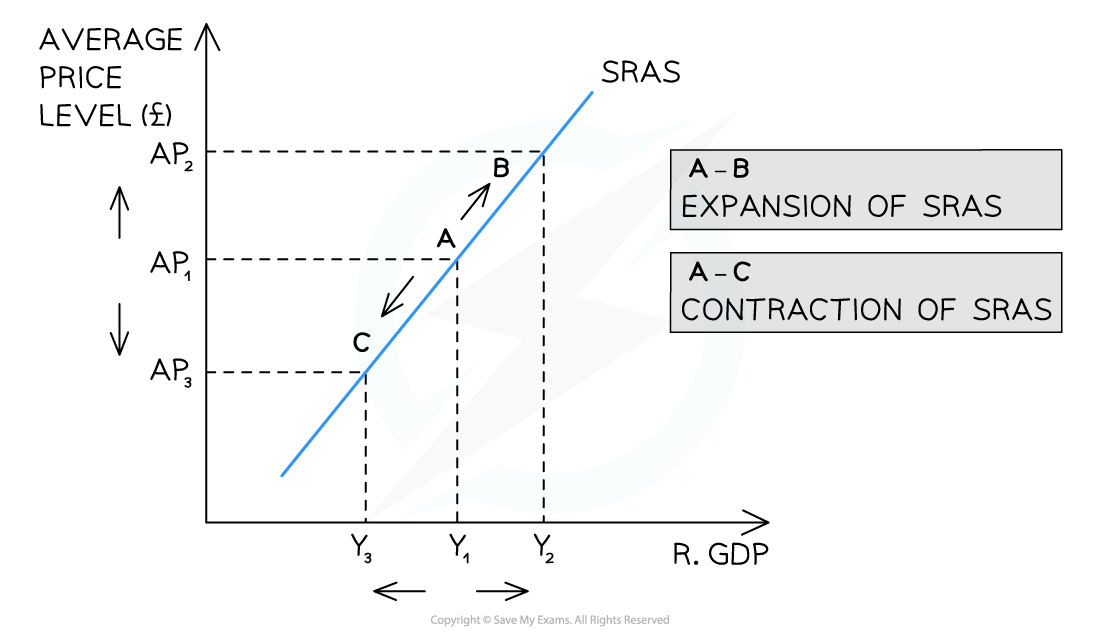
Diagram analysis
-
An increase in the AP (ceteris paribus) from AP1 → AP2 leads to a movement along the SRAS curve from A → B
-
There is an expansion (extension) of real GDP from Y1 → Y2
-
-
A decrease in the AP (ceteris paribus) from AP1 → AP3 leads to a movement along the SRAS curve from A → C
-
There is a contraction of real GDP (output) from Y1→Y3
-
A shift of the entire SRAS curve
-
Whenever there is a change in the conditions of supply in an economy (e.g. costs of production), there is a shift of the entire SRAS curve

Diagram analysis
-
A decrease in labour costs results in a shift right of the entire curve from SRAS1 → SRAS2
-
At every price level, output and real GDP have increased from Y1 → Y2
-
-
An increase in labour costs results in a shift left of the entire curve from SRAS1 → SRAS3
-
At every price level, output and real GDP have decreased from Y1 → Y3
-
The Relationship Between Short-run & Long-run AS
-
Short run aggregate supply (SRAS) is influenced by changes in the costs of production
-
Short run refers to the time period where at least one factor of production is fixed
-
-
Long run aggregate supply (LRAS) is influenced by a change in the productive capacity of the economy
-
Productive capacity is changed by changes to the quantity or quality of the factors of production
-
When production capacity changes, it is equivalent to a shift inwards/outwards of the production possibilities frontier (PPF)
-
-
-
Long term economic growth requires the productive capacity to increase
Responses