
Economics-A-level-Aqa
-
1-economic-methodology-and-the-economic-problem4 主题
-
2-individual-economic-decision-making4 主题
-
3-price-determination-in-competitive-markets10 主题
-
types-of-economic-integration
-
protectionist-policies-quotas-and-export-subsidies
-
protectionist-policies-tariffs
-
protectionist-policies-an-introduction
-
the-benefits-and-costs-of-trade
-
international-trade
-
globalisation
-
types-of-supply-side-policies
-
an-introduction-to-supply-side-policies
-
fiscal-policy-budget-balances-and-national-debt
-
types-of-economic-integration
-
4-production-costs-and-revenue11 主题
-
Production & Productivity
-
fiscal-policy-types-of-public-expenditure-and-taxation
-
fiscal-policy-an-introduction
-
regulating-the-financial-system
-
monetary-policy-transmission-mechanisms
-
central-banks-and-monetary-policy
-
commercial-and-investment-banks
-
financial-assets
-
financial-markets
-
conflicts-between-the-macroeconomic-objectives
-
price-level-global-influences
-
Production & Productivity
-
5-perfect-and-imperfectly-competitive-markets-and-monopolies12 主题
-
price-level-deflation
-
price-level-inflation
-
employment-and-unemployment
-
the-economic-cycle
-
the-impact-of-economic-growth
-
economic-growth
-
the-multiplier-and-basic-accelerator-process
-
macroeconomic-equilibrium
-
long-run-aggregate-supply-lras
-
short-run-aggregate-supply-sras
-
aggregate-demand-ad
-
injections-and-withdrawals-into-the-circular-flow
-
price-level-deflation
-
6-the-labour-market7 主题
-
7-income-and-wealth-distribution4 主题
-
8-the-market-mechanism-market-failure-and-government-intervention16 主题
-
government-intervention-price-controls
-
government-intervention-indirect-taxation-and-subsidies
-
government-intervention-an-introduction
-
market-failure-market-imperfections
-
market-failure-merit-and-demerit-goods
-
market-failure-tragedy-of-the-commons
-
market-failure-positive-externalities
-
market-failure-negative-externalities
-
market-failure-public-private-and-quasi-public-goods
-
an-introduction-to-market-failure
-
the-market-price-mechanism
-
government-policies-to-reduce-poverty-and-inequity
-
the-problem-of-poverty
-
the-lorenz-curve-and-gini-coefficient
-
income-and-wealth-distribution
-
discrimination-in-the-labour-market
-
government-intervention-price-controls
-
9-measuring-macroeconomic-performance5 主题
-
10-how-the-macroeconomy-works6 主题
-
11-economic-performance8 主题
-
12-financial-markets-and-monetary-policy6 主题
-
13-fiscal-and-supply-side-policies5 主题
-
14-the-international-economy16 主题
-
using-index-numbers
-
analysing-changes-to-market-equilibrium
-
the-determination-of-market-equilibrium
-
supply-curves-real-world-analysis
-
supply-curves
-
demand-curves-real-world-analysis
-
demand-curves
-
using-behavioural-economics
-
behavioural-economics
-
imperfect-information
-
consumer-behaviour
-
production-possibility-diagrams
-
scarcity-choice-and-the-allocation-of-resources
-
economic-resources
-
economic-activity
-
economic-methodology
-
using-index-numbers
supply-curves
An Introduction to Supply
-
Supply is the amount of a good/service that a producer is willing and able to supply at a given price in a given time period
-
A supply curve is a graphical representation of the price and quantity supplied by producers
-
If the data were plotted, it would be an actual curve. Economists, however, use straight lines so as to make analysis easier
-
-
The supply curve is sloping upward as there is a positive relationship between the price and quantity supplied (QS)
-
Rational profit maximising producers would want to supply more as prices increase in order to maximise their profits
-
-
The law of supply states that there is a positive (direct) relationship between quantity supplied and price, ceteris paribus
-
When the price rises, the QS rises
-
When the price falls, the QS falls
-
Individual and Market Supply
-
Market supply is the combination of all the individual supply for a good/service
-
It is calculated by adding up the individual supply at each price level
-
The Monthly Market Supply of Bread from 4 Bakeries in a Small town
|
Bakery 1 |
Bakery 2 |
Bakery 3 |
Bakery 4 |
Market Supply |
|
300 |
600 |
180 |
320 |
1400 loaves |
Diagram: Individual & Market Supply Curves
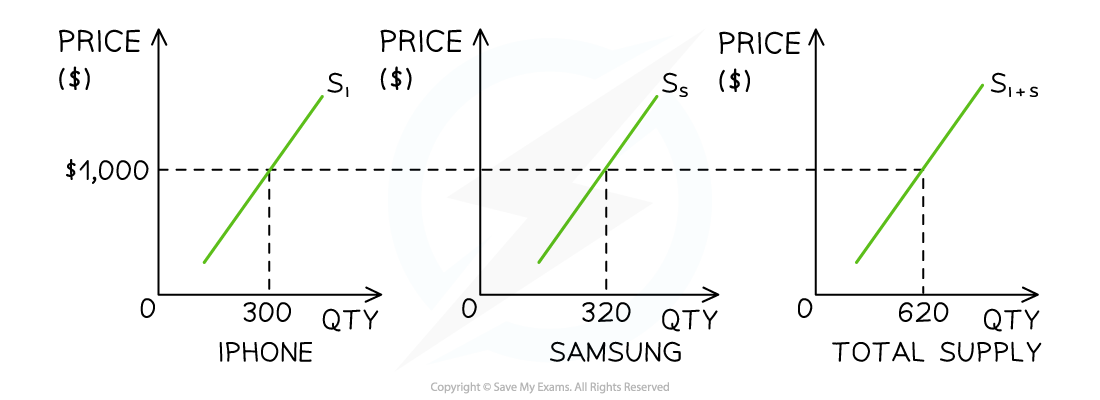
Diagram analysis
-
In New York City, the market supply for smart phones in December is predominantly a combination of iPhone and Samsung supply
-
At a price of $1000, the supply of iPhones is 300 units and the supply of Samsung phones is 320 units
-
At a price of $1,000, the market supply of smart phones in New York City during December is 620 units
Movements Along a Supply Curve
-
If price is the only factor that changes (ceteris paribus), there will be a change in the quantity supplied (QS)
-
This change is shown by a movement along the supply curve
-
Diagram: Movement Along a Supply Curve
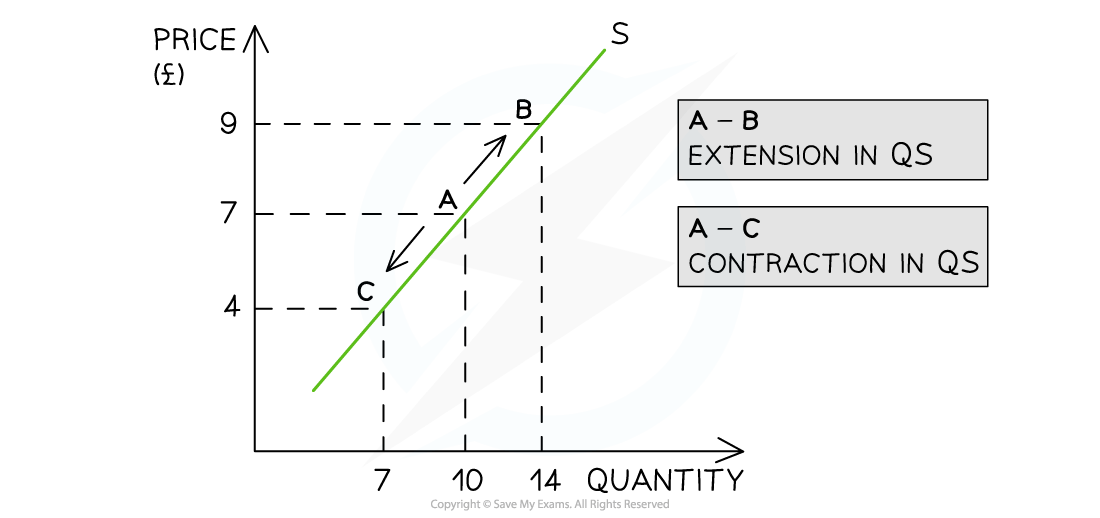
Diagram analysis
-
An increase in price from £7 to £9 leads to a movement up the supply curve from point A to B
-
Due to the increase in price, the quantity supplied has increased from 10 to 14 units
-
This movement is called an extension in QS
-
-
A decrease in price from £7 to £4 leads to a movement down the supply curve from point A to C
-
Due to the decrease in price, the quantity supplied has decreased from 10 to 7 units
-
This movement is called a contraction in QS
-
The Conditions of Supply
-
There are several factors that will change the supply of a good/service, irrespective of the price level. Collectively, these factors are called the conditions of supply and include:
-
Changes to the costs of production
-
Changes to indirect taxes and subsidies
-
Changes to technology
-
Changes to the number of firms
-
Weather events
-
Future price expectations
-
Goods in joint and competitive supply
-
-
Changes to any of the conditions of supply shift the entire supply curve (as opposed to a movement along the supply curve)
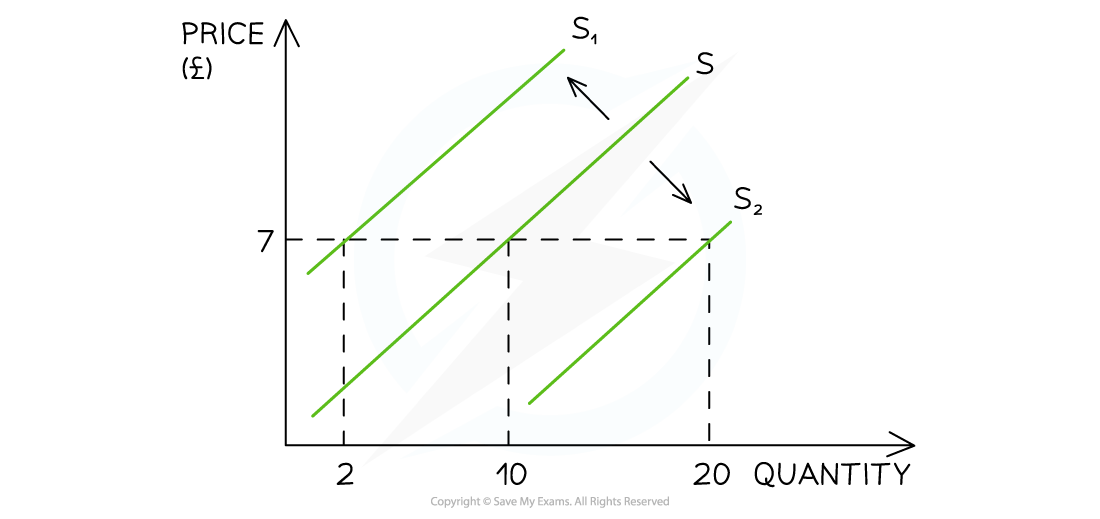
Diagram: Shift of the Supply Curve
-
E.g. If a firm’s cost of production increases due to the increase in price of a key resource, then there will be a decrease in supply as the firm can now only afford to produce fewer products
-
This is a shift in supply from S to S1. The price remains unchanged at £7 but the supply has decreased from 10 to 2 units
-
An Explanation of how each of the Conditions of Supply Shifts the Entire Supply
Curve at Every Price Level
|
Condition of Supply |
Explanation |
Factor |
Shift |
Factor |
Shift |
|---|---|---|---|---|---|
|
Changes to costs of production |
|
COP |
S decreases, shifting left |
COP |
S increases, shifting right |
|
Indirect taxes |
|
Taxes Increase |
S decreases, shifting left |
Taxes Decrease |
|
|
Subsidies |
|
Subsidy Increases |
S increases, shifting right |
Subsidy Decreases |
|
|
New technology |
|
Technology Increases |
S increases, shifting right |
Technology Decreases |
S decreases, shifting left |
|
Change in the number of firms in the industry |
|
No. of Firms Increases |
S increases, shifting right |
No. of Firms Decreases |
S decreases, shifting left |
Responses