
The nature and purpose of critical path analysis
-
Critical path analysis is a project management tool that uses network analysis to plan complex and time-sensitive projects
-
Critical path analysis involves the construction of a visual model of the project that includes key elements:
-
A list of all activities required to complete the project
-
The time (duration) that each activity will take to complete
-
How each project activity depends on others
-
-
Critical path analysis shows:
-
The order in which activities must be completed
-
The longest path of project activities to the completion of the project
-
The earliest and latest that each project activity can start and finish without delaying completion of the project as a whole
-
Activities within a project that can be carried out simultaneously
-
The critical project activities that, if delayed, will cause the project as a whole to overrun
-
Those project activities where some delay is acceptable without delaying the project as a whole
-
The shortest time possible to complete the project
-
-
It allows managers to identify the relationships between the activities involved and to work out the most efficient way of completing the project
-
Resources such as raw materials and components can be ordered or hired at precisely the right time they are needed
-
Working capital may be managed efficiently
-
Where delays occur, managers can identify the implications for the project’s completion and redirect resources if required
-
Drawing critical path analysis diagrams
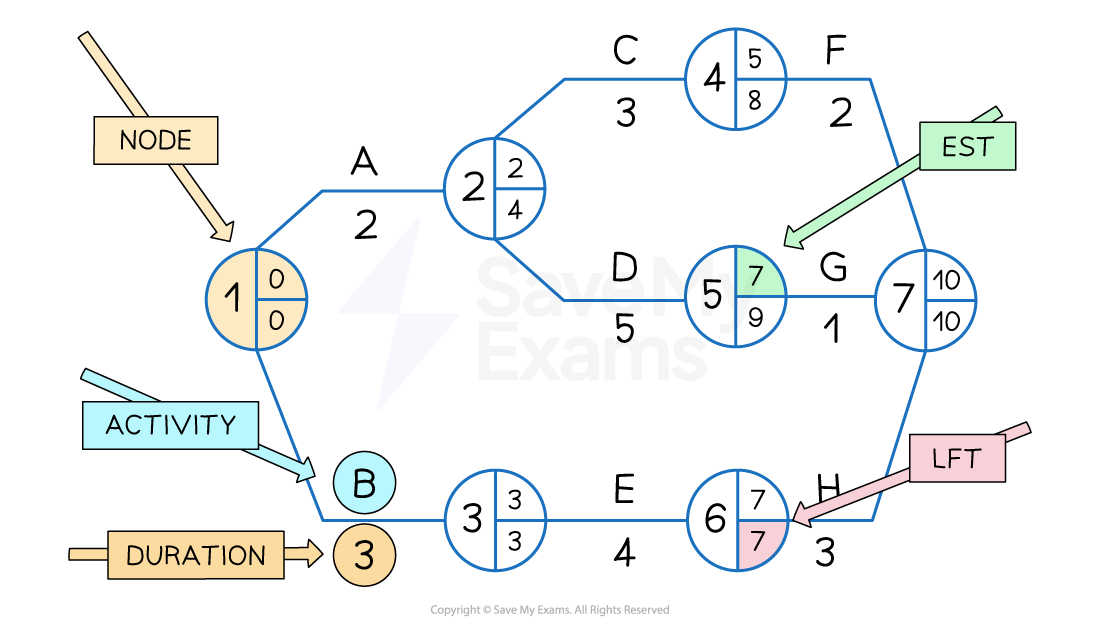
Components of network analysis diagrams
|
Element |
Description |
|---|---|
|
Node |
|
|
Activities |
|
|
Duration |
|
Example network diagram
-
A network diagram must always start and end at a single node
-
Lines must not cross and must only be assigned to activities
Critical path calculations
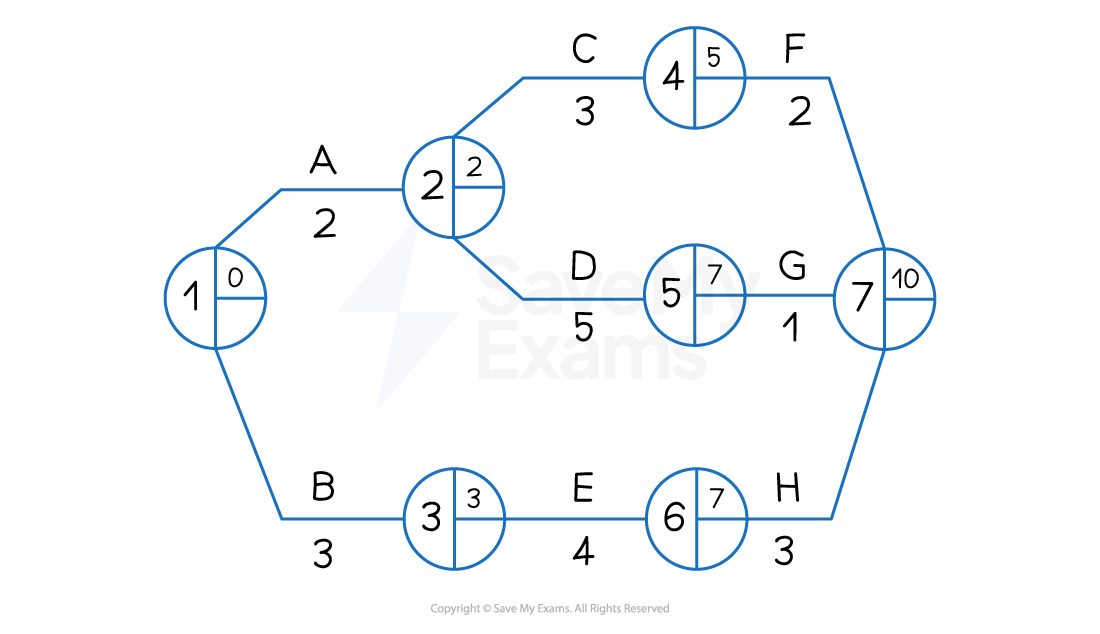
Earliest start times
-
Working forwards from Node 1, it is possible to calculate the earliest start time (EST) for each activity by adding the duration of each task
-
The EST for each activity is placed in the top right of each node
-
Node 1 is the starting point of the project and where both Activity A and Activity B begin
-
Activity A and Activity B are independent processes
-
Activity A has a duration of two days, and its EST is zero days
-
Activity B has a duration of three days, and its EST is also zero days
-
Activity C and Activity D both begin at Node 2 and are dependent upon the completion of Activity A but are independent from each other
-
Activity C has a duration of three days, and its EST is two days
-
Activity D has a duration of five days, and its EST is also two days
-
-
Activity E begins at Node 3
-
Activity E has a duration of four days, and its EST is three days
-
-
Activity F begins at Node 4
-
Activity F has a duration of two days, and its EST is five days
-
-
Activity G begins at Node 5
-
Activity G has a duration of one day, and its EST is seven days
-
-
Activity H begins at Node 6
-
Activity H has a duration of three days, and its EST is seven days
-
-
Node 7 is the endpoint of the project
-
Latest finish times

-
Working backwards from Node 7, it is now possible to calculate the latest finish time (LFT) for each activity by subtracting the duration of each task
-
The LFT for each activity is placed in the bottom right of each node
-
Node 7 is the endpoint of the project, which has an LFT of ten days
-
Activity H has a duration of three days
-
The LFT in Node 6 is seven days (10 days − 3 days)
-
-
Activity G has a duration of one day
-
The LFT in Node 5 is nine days (10 days − 1 day)
-
-
Activity F has a duration of two days
-
The LFT in Node 4 is eight days (10 days − 2 days)
-
-
Activity E has a duration of four days
-
The LFT in Node 3 is three days (7 days − 4 days)
-
-
Activity D has a duration of five days
-
The LFT in Node 2 is four days (9 days − 5 days)
-
-
Activity C has a duration of three days
-
The LFT in Node 3 is four days because Activity D is the more time-critical of the two activities that are dependent upon the completion of Activity A, so its LFT is recorded
-
-
Activity B has a duration of three days
-
The LFT in Node 1 is zero days (3 days − 3 days)
-
-
Activity A has a duration of two days
-
The LFT in Node 1 is zero days because Activity B is the more time-critical of the two starting activities, so its LFT is recorded
-
-
-
The LFT in Node 1 is always zero
Identifying the critical path
-
The critical path highlights those activities that determine the length of the whole project
-
If any of these critical activities are delayed, the project as a whole will be delayed
-
The critical path follows the nodes where the EST and LFT are equal
-
In the diagram below, Nodes 1, 3, 6 and 7 have equal ESTs and LFTs
-
Activities that determine these nodes are B, E and H
-
These activities are marked with two short lines
-
The critical path is therefore BEH
-
-

Identifying and calculating float time
-
Float time exists where there is a difference between the EST and the LFT
-
Where float time is identified, managers may:
-
Transfer resources, such as staff or machinery, to more critical activities
-
Allow extra time to complete tasks to improve quality or allow for creativity
-
Responses