
Introduction to quantitative sales forecasting
-
The sales forecast is an important business planning tool
-
It provides an estimation of future sales figures using past data and considering predictable external factors
-
-
Sales forecasts can be used to identify trends in product sales, which can then be compared with the market as a whole
Methods used in quantitative sales forecasting
|
Method |
Explanation |
|---|---|
|
Moving averages |
|
|
Extrapolation |
|
|
Correlation |
|
Calculation of time: Series analysis
Moving averages
-
Sometimes, past sales data is too erratic for clear trends to be identified
-
A moving average smooths raw data and allows analysts to spot patterns, even when sales are subject to seasonal variations
-
Four-month or twelve-month moving averages are used where seasonality is a key factor in sales
Calculating moving averages
-
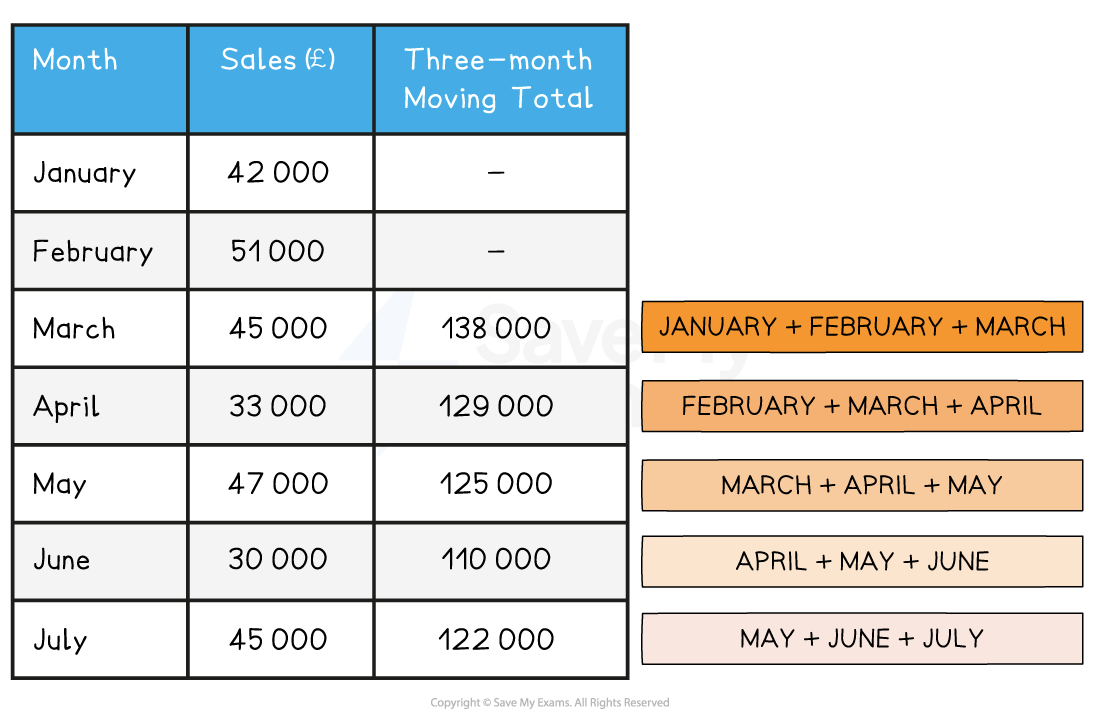
The moving total is calculated by adding together sales figures for a specified number of periods
-
E.g. a three-month moving total is calculated by adding the first three months, followed by the second three months and the third three months and so on
-
-
The centred average is calculated by dividing the moving total by the specified number of periods
-
E.g. a three-month centred average is calculated by dividing the three-month moving total by three
-
-
A series of centred averages is known as the moving average
Worked Example
RJ Inflatables is a manufacturer of novelty celebration balloons. Its monthly sales from January to July are shown in Table A.
Rachel Jameson, the managing director, is concerned that sales are declining but is struggling to identify a trend with the sales data she has available. Rachel’s financial administrator has suggested using a moving average so that she can forecast future sales with greater accuracy.
Table A
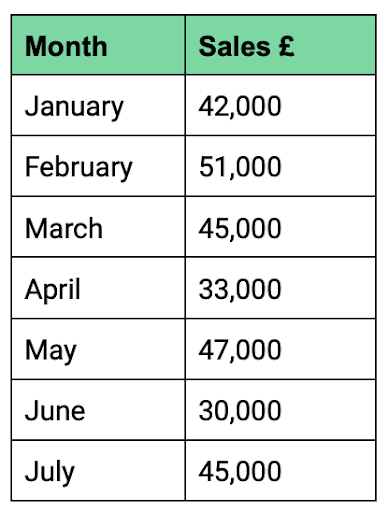
Calculate a three-month moving average using RJ Inflatables’s January to July sales data.
(6)
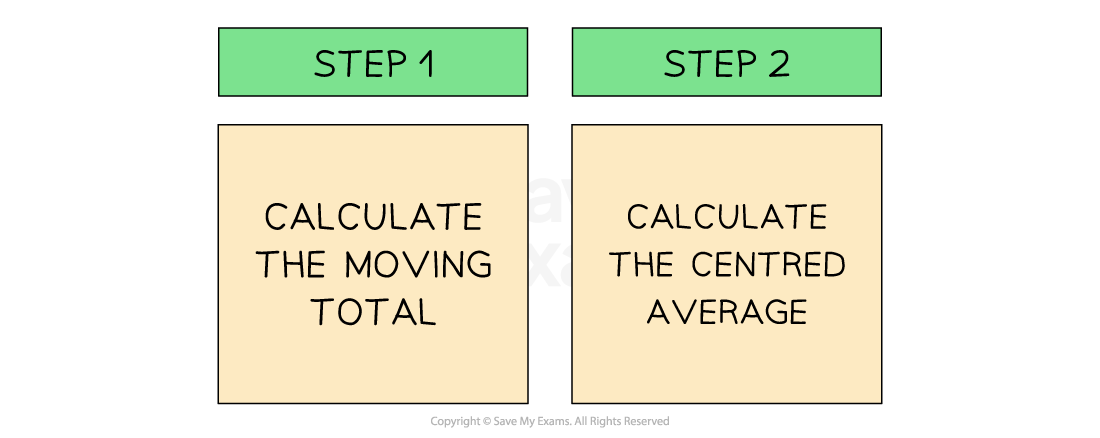
Step 1: Calculate the three-month moving total of sales for each group of three months
Step 2: Calculate the three-month centred average for each group of three months

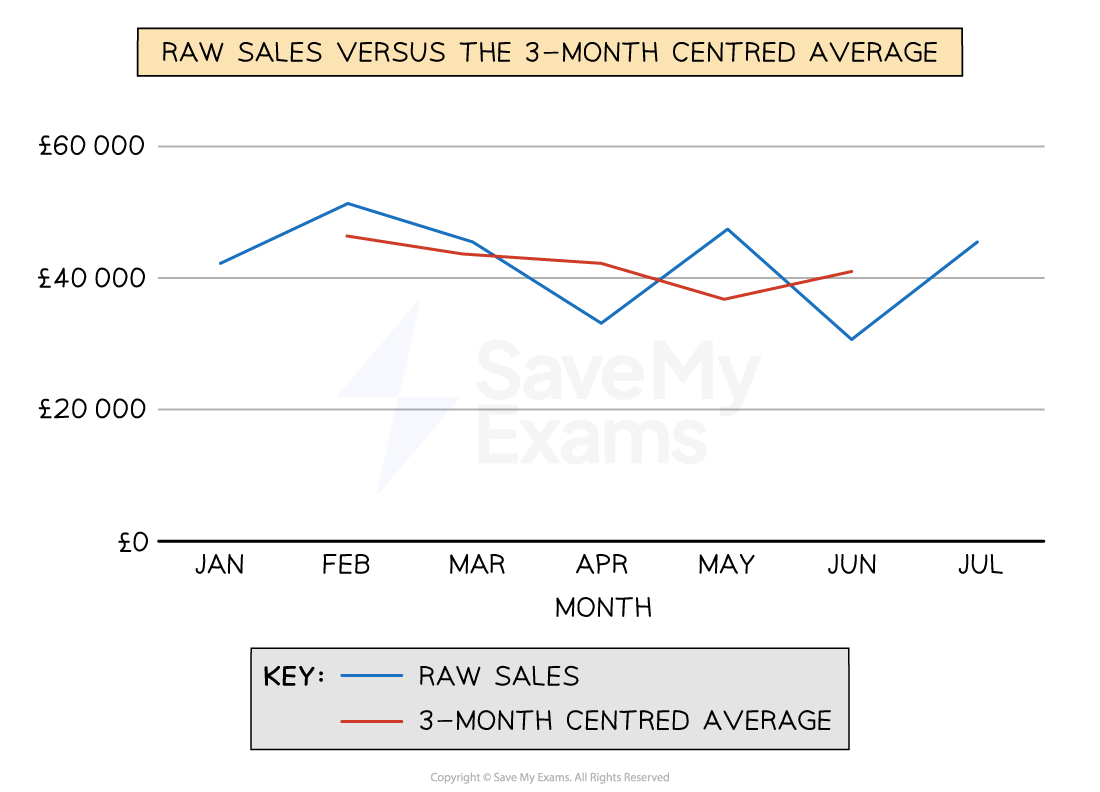
-
When plotted on the same graph, the three-month centred average provides a smoother curve, which makes extrapolation of the data for forecasting relatively straightforward
Raw data compared to the moving average
Interpreting scatter graphs
-
Scatter graphs allow businesses to compare two variables, such as sales volume and advertising, to establish if there is any correlation between them
Responses