
Business_A-level_Edexcel
-
1-marketing-and-people
1-1-meeting-customer-needs3 主题 -
1-2-market5 主题
-
1-3-marketing-mix-and-strategy5 主题
-
1-4-managing-people5 主题
-
1-5-entrepreneurs-and-leaders6 主题
-
2-managing-business-activities2-1-raising-finance4 主题
-
2-2-financial-planning4 主题
-
2-3-managing-finance3 主题
-
2-4-resource-management4 主题
-
2-5-external-influences3 主题
-
3-business-decisions-and-strategy3-1-business-objectives-and-strategy4 主题
-
3-2-business-growth4 主题
-
3-3-decision-making-techniques4 主题
-
3-4-influences-on-business-decisions4 主题
-
3-5-assessing-competitiveness3 主题
-
3-6-managing-change3 主题
-
4-global-business4-1-globalisation5 主题
-
4-2-global-markets-and-business-expansion5 主题
-
4-3-global-marketing3 主题
-
4-4-global-industries-and-multinational-corporations3 主题
-
5-exam-technique5-1-the-exam-papers4 主题
-
5-2-business-studies-skills1 主题
-
5-3-structuring-your-responses5 主题
-
6-pre-release-preparation2025-pre-release-music-industry9 主题
1-2-1-demand
An introduction to demand
-
Demand refers to the number of goods/services customers are willing to buy at a given price
-
Effective demand occurs when customers are willing and able (they have the money) to buy at a given price
-
-
There is an inverse relationship between the quantity demanded by customers and the price
-
As the price increases, the quantity demanded decreases
-
As the price decreases, the quantity demanded increases
-
Hence, the demand curve slopes downwards from left to right
-
-
This is illustrated in the diagram below
A simple demand curve
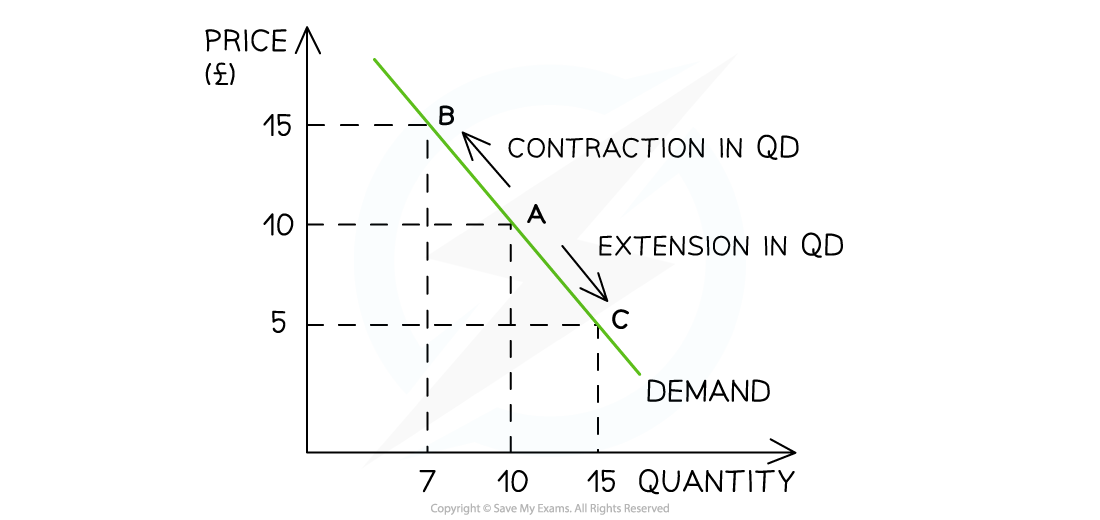
Diagram analysis
-
An increase in price from £10 to £15 leads to a movement up the demand curve from point A to point B
-
Due to the increase in price, the quantity demanded (QD) has fallen from 10 to 7 units
-
-
A decrease in price from £10 to £5 leads to a movement down the demand curve from point A to point C
-
Due to the decrease in price, the QD has increased from 10 to 15 units
-
Examiner Tips and Tricks
When writing about a movement along the demand curve, we use the term “quantity demanded“.
Factors leading to a change in demand
-
A change in price leads to a movement along the demand curve
-
However, a change in any other factors affecting demand will shift the entire demand curve to the left or right
-
These are called “non-price factors affecting demand“
-
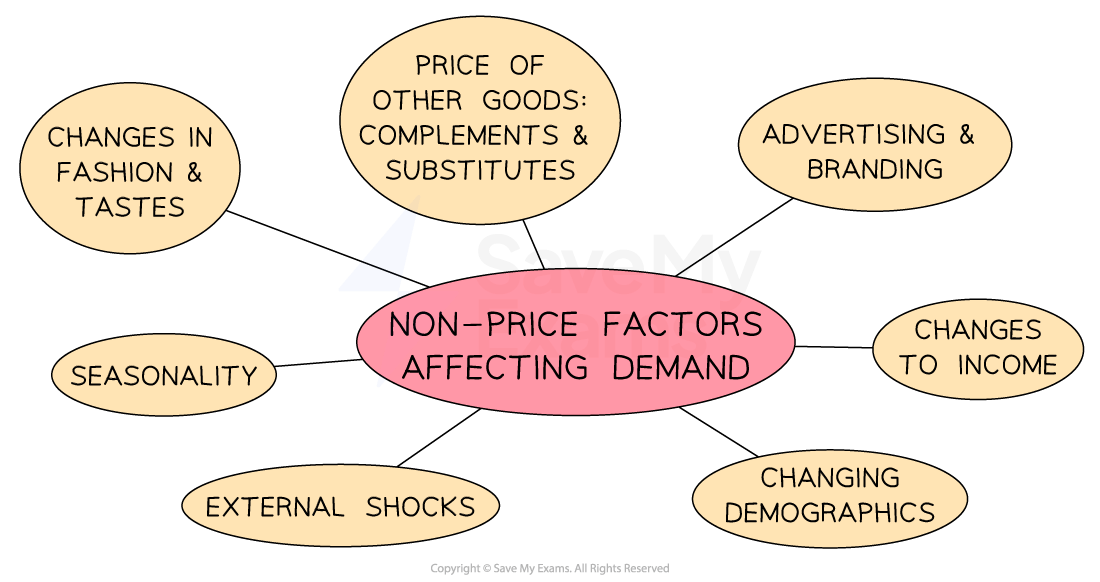
Non-price factors affecting demand
-
For example, if a firm increases its Instagram advertising, there will be an increase in demand as more consumers become aware of the product
-
This is a shift in demand from D to D1. The price remains unchanged at £7, but the demand has increased from 15 to 25 units
-
Changes in non-price factors
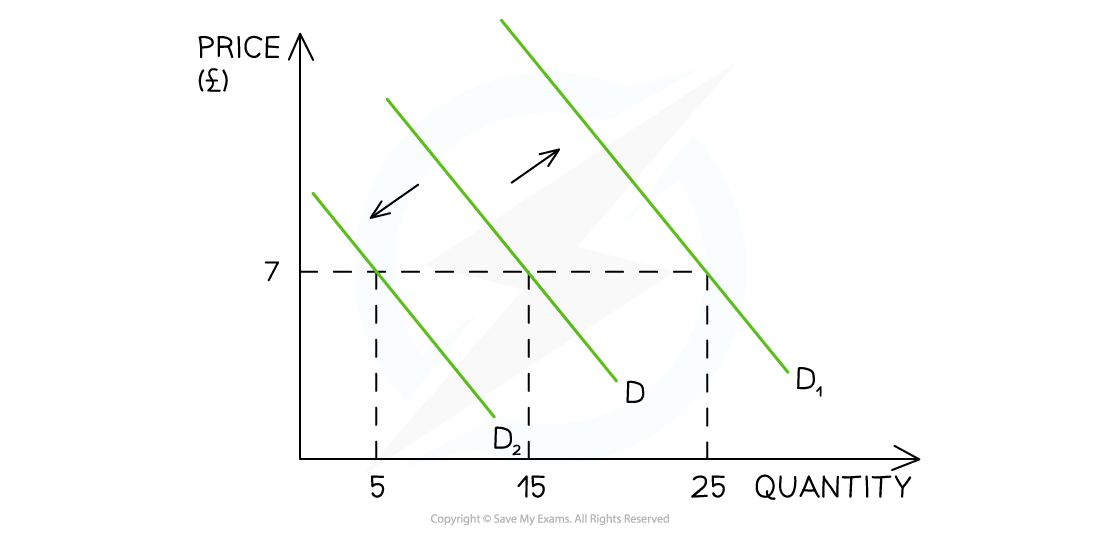
Diagram analysis
-
The initial demand curve is seen at D
-
At a price of £7, 15 units are demanded
-
-
If the price remains constant at £7 but demand decreases due to one of the non-price factors of demand (e.g. decreasing incomes), the entire demand curve shifts to the left, from D to D2
-
Demand has decreased from 15 units to 5 units
-
-
If the price remains constant at £10 but demand increases due to one of the non-price factors of demand (e.g. increased advertising expenditure), the entire demand curve shifts to the right, from D to D1
-
Demand has increased from 15 units to 25 units
-
Non-price factors affecting demand
|
Non-price factor |
Explanation |
Example |
|---|---|---|
|
Change in the price of substitutes |
|
|
|
Change in the price of complementary goods |
|
|
|
Change in consumer incomes |
|
|
|
|
|
|
Fashions, tastes and preferences |
|
|
|
Advertising and branding |
|
|
|
Demographics |
|
|
|
Seasonality |
|
|
|
External shocks |
|
|
Examiner Tips and Tricks
Remember, a change in any non-price factor that leads to less demand will shift the entire demand curve to the left, but a change in any non-price factor that leads to more demand will shift the entire demand curve to the right.
Responses