
Exam code:1BS0
Interpretation of bar gate stock graphs
-
A Bar Gate Stock Control diagram illustrates the flow of stock (inventory) into and out of a business over time
Example Bar Gate Stock Graph
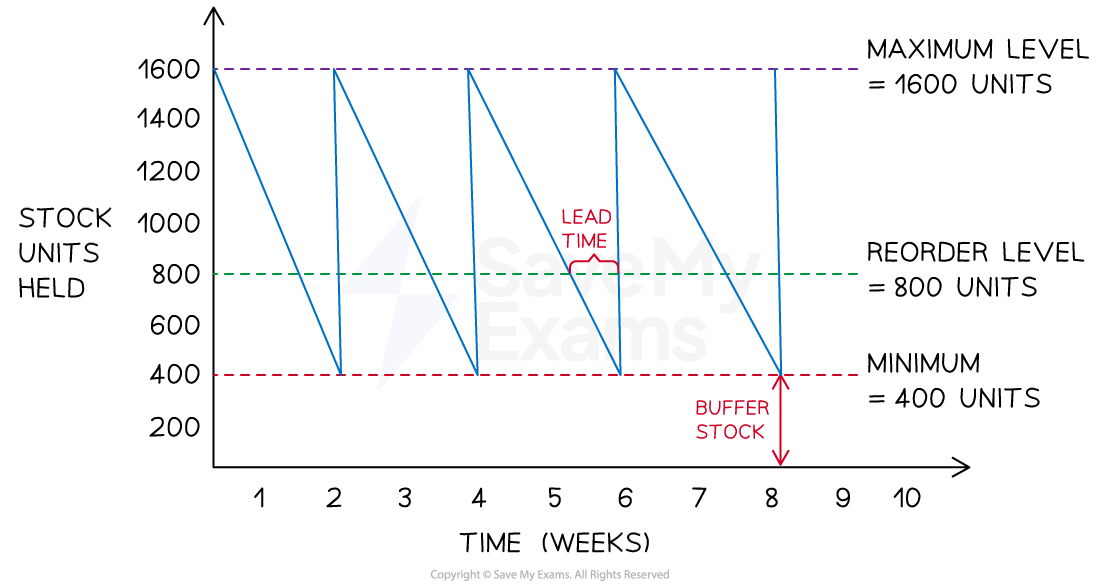
Diagram analysis
-
The maximum stock level is the maximum amount of stock a business is able to hold in normal circumstances (1600)
-
The reorder level is the level at which a business places a new order with its supplier (800)
-
The minimum stock level is also known as the buffer stock level and is the lowest level to which a business is willing to allow stock levels to fall (400)
-
The lead time is the length of time from the point of stock being ordered from the supplier to it being delivered (1 week)
-
The stock level line shows how stock levels change over the given time period
-
As stock is used up, a downwards slope is plotted
-
When an order is delivered by a supplier, the stock level line shoots upwards
-
Worked Example
The diagram below shows stock movements of kitchen shelving units sold by TamFix Ltd.

Identify the following points:
-
the minimum stock level
-
the re-order level
-
the re-order quantity
-
the lead time for kitchen shelving units
(4)
Step 1: Identify the minimum stock level
-
The minimum stock level is identified by the bottom-most dotted line. In this case it shows that the minimum stock level is 200 units (1)
Step 2: Identify the reorder level
-
The reorder level is clearly identified on the diagram. In this case, it shows that the reorder level is 500 units (1)
Step 3: Identify the reorder quantity
-
The reorder quantity is the difference between the maximum stock level (shown by the topmost dotted line) and the minimum stock level
format('truetype')%3Bfont-weight%3Anormal%3Bfont-style%3Anormal%3B%7D%3C%2Fstyle%3E%3C%2Fdefs%3E%3Ctext%20font-family%3D%22math143f4d31b04031e49f5eb18baba%22%20font-size%3D%2216%22%20text-anchor%3D%22middle%22%20x%3D%228.5%22%20y%3D%2216%22%3E%3D%3C%2Ftext%3E%3Ctext%20font-family%3D%22Times%20New%20Roman%22%20font-size%3D%2218%22%20text-anchor%3D%22middle%22%20x%3D%2239.5%22%20y%3D%2216%22%3E1000%3C%2Ftext%3E%3Ctext%20font-family%3D%22Times%20New%20Roman%22%20font-size%3D%2218%22%20text-anchor%3D%22middle%22%20x%3D%2278.5%22%20y%3D%2216%22%3Eunits%3C%2Ftext%3E%3Ctext%20font-family%3D%22math143f4d31b04031e49f5eb18baba%22%20font-size%3D%2216%22%20text-anchor%3D%22middle%22%20x%3D%22108.5%22%20y%3D%2216%22%3E%26%23x2212%3B%3C%2Ftext%3E%3Ctext%20font-family%3D%22Times%20New%20Roman%22%20font-size%3D%2218%22%20text-anchor%3D%22middle%22%20x%3D%22134.5%22%20y%3D%2216%22%3E200%3C%2Ftext%3E%3Ctext%20font-family%3D%22Times%20New%20Roman%22%20font-size%3D%2218%22%20text-anchor%3D%22middle%22%20x%3D%22169.5%22%20y%3D%2216%22%3Eunits%3C%2Ftext%3E%3Ctext%20font-family%3D%22math143f4d31b04031e49f5eb18baba%22%20font-size%3D%2216%22%20text-anchor%3D%22middle%22%20x%3D%228.5%22%20y%3D%2263%22%3E%3D%3C%2Ftext%3E%3Ctext%20font-family%3D%22Times%20New%20Roman%22%20font-size%3D%2218%22%20text-anchor%3D%22middle%22%20x%3D%2234.5%22%20y%3D%2263%22%3E800%3C%2Ftext%3E%3Ctext%20font-family%3D%22Times%20New%20Roman%22%20font-size%3D%2218%22%20text-anchor%3D%22middle%22%20x%3D%2269.5%22%20y%3D%2263%22%3Eunits%3C%2Ftext%3E%3C%2Fsvg%3E) (1)
(1)
Step 4: Identify the lead time for kitchen shelving units
-
The lead time is the difference in time between an order for stock being placed and its delivery
-
In this case, assuming a five-day working week, the lead time for shelving units is two days (1)
Efficient procurement of raw materials
-
Efficient procurement of raw materials is crucial for ensuring the success of any manufacturing process
-
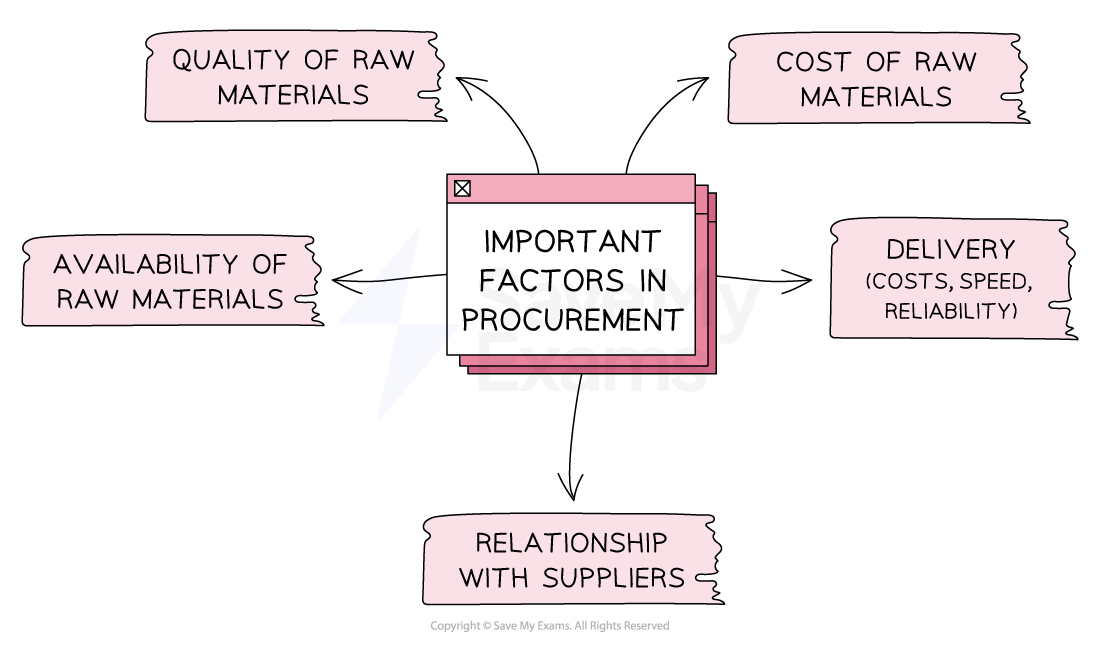
There are several factors that can influence the efficiency of raw material procurement
Important factors in procurement
-
Businesses need to carefully consider these factors when sourcing raw materials to ensure that they can efficiently produce high-quality products at a reasonable cost
Factors that influence the sourcing of raw materials
|
Factor |
Explanation |
Example |
|---|---|---|
|
Quality |
|
|
|
Delivery |
|
|
|
Availability |
|
|
|
Costs |
|
|
|
Trust |
|
|
Just in time stock management
-
Just in Time (JIT) stock management is a process in which raw materials are not stored onsite but ordered as required and delivered by suppliers ‘just in time’ to be used
-
Careful coordination is required ensure that raw materials and components are delivered by suppliers at the moment that they are to be used
Responses