
Business AS AQA
-
1-1-the-nature-and-purpose-of-business as3 主题
-
1-2-forms-of-business as5 主题
-
1-3-the-external-environment as5 主题
-
2-1-management-and-leadership as3 主题
-
2-2-management-decision-making as4 主题
-
2-3-the-role-and-importance-of-stakeholders as3 主题
-
3-1-marketing-objectives as1 主题
-
3-2-understanding-markets-and-customers as5 主题
-
3-3-making-marketing-decisions as2 主题
-
3-4-the-marketing-mix as7 主题
-
4-1-operational-objectives as2 主题
-
4-2-operational-performance as1 主题
-
4-3-efficiency-and-productivity as3 主题
-
4-4-quality as1 主题
-
4-5-inventory-and-supply-chain-management as3 主题
-
5-1-financial-objectives as2 主题
-
5-2-financial-performance as6 主题
-
5-3-sources-of-finance as3 主题
-
5-4-cash-flow-and-profit as1 主题
-
6-1-human-resource-objectives as1 主题
-
6-2-human-resource-performance as1 主题
-
6-3-organisational-design as3 主题
-
6-4-human-resource-planning as4 主题
-
6-5-motivation as1 主题
-
6-6-improving-employer-employee-relations as2 主题
calculating-and-interpreting-human-resource-data as
Exam code:7131
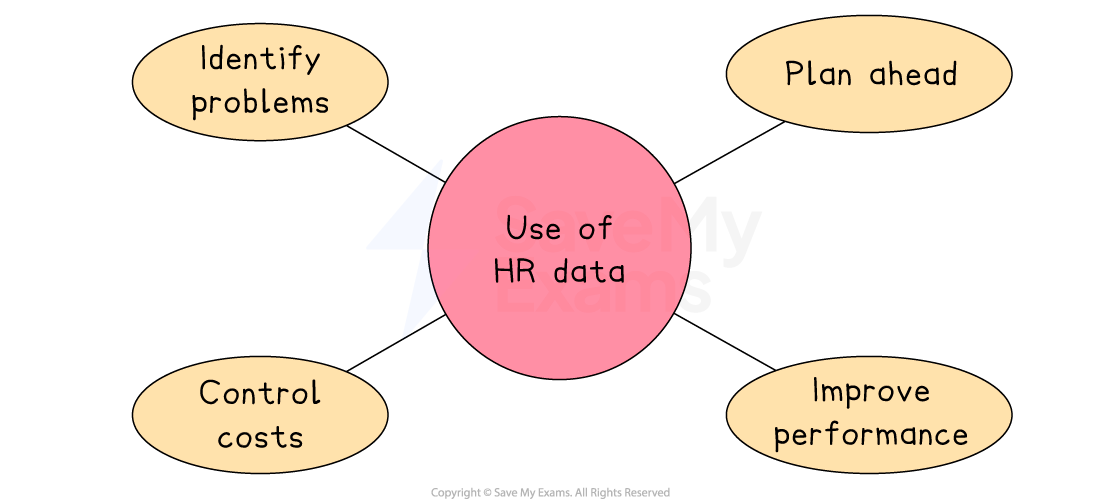
Using data to make HR decisions
-
Businesses collect and analyse HR data to make informed decisions that help improve performance, reduce costs and plan for future workforce needs
Why HR data matters
-
Identify problems
-
High labour turnover or rising costs may indicate poor working conditions, low morale or training gaps
-
-
Plan ahead
-
Workforce data informs recruitment, training, succession planning and budgeting
-
-
Improve performance
-
Tracking productivity or absenteeism helps managers take action to boost efficiency
-
-
Control costs
-
Monitoring labour cost per unit and employee costs as a percentage of turnover helps businesses stay competitive
-
Strategic workforce planning
-
Data-driven planning helps ensure the business has the right number of people, with the right skills, in the right roles. For example:
-
A retailer planning to open new stores can use HR data to forecast how many staff it will need and how much it will cost
-
A manufacturer may use productivity data to decide whether it needs to recruit more staff or invest in automation
-
-
Good HR planning based on reliable data supports long-term business success and helps avoid costly mistakes such as overstaffing or skill shortages
Labour turnover
-
Labour turnover measures the proportion of employees leaving a business during a specific time period
-
It is expressed as a percentage and is calculated using the formula:
![]()
Internal and external factors that affect labour turnover
-
A rising rate of labour turnover can signal internal HR management problems such as
-
Poor management leading to workers losing commitment
-
A poor recruitment and selection approach leading to staff leaving soon after starting their job
-
Low wage levels compared to those that could be earned elsewhere
-
-
External factors can also increase labour turnover in a business
-
A buoyant local economy where workers are attracted to employment opportunities elsewhere
-
Improved transport links that provide an opportunity for workers to seek work across a wider geographical area
-
The consequences of high labour turnover
|
Problems |
Opportunities |
|---|---|
|
|
Worked Example
In 2022, Domus Construction Ltd employed 7,200 workers, six per cent of whom worked at the head office.
During 2022, fifty-four head office employees left the business.
Calculate the labour turnover of Domus Construction’s head office in 2022.
[3]
Step 1 – Calculate the number of head office workers
![]() (1)
(1)
Step 2 – Apply the labour turnover formula
<img alt=”Labour space Turnover space equals fraction numerator Number space of space Staff space Leaving over denominator Average space Number space of space Staff end fraction space space cross times space 100 Labour space Turnover space equals 54 over 432 space space equals space 0.125 space cross times space 100 space equals space 12.5 percent sign space” data-mathml=”<math style=”font-family:Arial” ><semantics><mstyle mathsize=”14px”><mi>Labour</mi><mo> </mo><mi>Turnover</mi><mo> </mo><mo>=</mo><mfrac><mrow><mi>Number</mi><mo> </mo><mi>of</mi><mo> </mo><mi>Staff</mi><mo> </mo><mi>Leaving</mi></mrow><mrow><mi>Average</mi><mo> </mo><mi>Number</mi><mo> </mo><mi>of</mi><mo> </mo><mi>Staff</mi></mrow></mfrac><mo> </mo><mo> </mo><mo>×</mo><mo> </mo><mn>100</mn><mspace linebreak=”newline”/><mspace linebreak=”newline”/><mi>Labour</mi><mo> </mo><mi>Turnover</mi><mo> </mo><mo>=</mo><mfrac><mn>54</mn><mn>432</mn></mfrac><mo> </mo><mo> </mo><mo>=</mo><mo> </mo><mn>0</mn><mo>.</mo><mn>125</mn><mo> </mo><mo>×</mo><mo> </mo><mn>100</mn><mo> </mo><mo>=</mo><mo> </mo><mn>12</mn><mo>.</mo><mn>5</mn><mo>%</mo><mo> </mo></mstyle><annotation encoding=”application/vnd.wiris.mtweb-params+json”>{“fontFamily”:”Times New Roman”,”fontSize”:”18″,”autoformat”:true,”toolbar”:”<to
Responses