
Business AS AQA
-
1-1-the-nature-and-purpose-of-business as3 主题
-
1-2-forms-of-business as5 主题
-
1-3-the-external-environment as5 主题
-
2-1-management-and-leadership as3 主题
-
2-2-management-decision-making as4 主题
-
2-3-the-role-and-importance-of-stakeholders as3 主题
-
3-1-marketing-objectives as1 主题
-
3-2-understanding-markets-and-customers as5 主题
-
3-3-making-marketing-decisions as2 主题
-
3-4-the-marketing-mix as7 主题
-
4-1-operational-objectives as2 主题
-
4-2-operational-performance as1 主题
-
4-3-efficiency-and-productivity as3 主题
-
4-4-quality as1 主题
-
4-5-inventory-and-supply-chain-management as3 主题
-
5-1-financial-objectives as2 主题
-
5-2-financial-performance as6 主题
-
5-3-sources-of-finance as3 主题
-
5-4-cash-flow-and-profit as1 主题
-
6-1-human-resource-objectives as1 主题
-
6-2-human-resource-performance as1 主题
-
6-3-organisational-design as3 主题
-
6-4-human-resource-planning as4 主题
-
6-5-motivation as1 主题
-
6-6-improving-employer-employee-relations as2 主题
break-even-analysis as
Exam code:7131
The value of break-even analysis
-
Break-even analysis is a financial tool used to determine the point at which the business revenue equals its expenses, resulting in neither profit nor loss
-
It helps businesses understand the minimum level of sales or output they need to achieve to cover all costs
-
This helps managers make informed decisions about pricing and production volumes
-
-
It is particularly useful for communicating with stakeholders, including investors or lenders
-
It demonstrates the financial viability of the business and gives an insight into potential return on investment
-
Revenue and costs
-
Break-even analysis takes into account three main components
The components of break-even analysis
Sales revenue
-
Sales revenue is the value of the units sold by a business over a period of time
-
E.g. the revenue earned by Apple Music from sales of music downloads
-
Sales revenue is a key business performance measure and must be calculated to identify profit
-
Sales revenue is calculated using the formula
format('truetype')%3Bfont-weight%3Anormal%3Bfont-style%3Anormal%3B%7D%3C%2Fstyle%3E%3C%2Fdefs%3E%3Ctext%20font-family%3D%22Arial%22%20font-size%3D%2214%22%20text-anchor%3D%22middle%22%20x%3D%2217.5%22%20y%3D%2214%22%3ESales%3C%2Ftext%3E%3Ctext%20font-family%3D%22Arial%22%20font-size%3D%2214%22%20text-anchor%3D%22middle%22%20x%3D%2264.5%22%20y%3D%2214%22%3Erevenue%3C%2Ftext%3E%3Ctext%20font-family%3D%22math17f39f8317fbdb1988ef4c628eb%22%20font-size%3D%2214%22%20text-anchor%3D%22middle%22%20x%3D%22102.5%22%20y%3D%2214%22%3E%3D%3C%2Ftext%3E%3Ctext%20font-family%3D%22Arial%22%20font-size%3D%2214%22%20text-anchor%3D%22middle%22%20x%3D%22140.5%22%20y%3D%2214%22%3EQuantity%3C%2Ftext%3E%3Ctext%20font-family%3D%22Arial%22%20font-size%3D%2214%22%20text-anchor%3D%22middle%22%20x%3D%22183.5%22%20y%3D%2214%22%3Esold%3C%2Ftext%3E%3Ctext%20font-family%3D%22Arial%22%20font-size%3D%2214%22%20text-anchor%3D%22middle%22%20x%3D%22203.5%22%20y%3D%2214%22%3Ex%3C%2Ftext%3E%3Ctext%20font-family%3D%22Arial%22%20font-size%3D%2214%22%20font-style%3D%22italic%22%20text-anchor%3D%22middle%22%20x%3D%22215.5%22%20y%3D%2214%22%3ES%3C%2Ftext%3E%3Ctext%20font-family%3D%22Arial%22%20font-size%3D%2214%22%20text-anchor%3D%22middle%22%20x%3D%22237.5%22%20y%3D%2214%22%3Eelling%3C%2Ftext%3E%3Ctext%20font-family%3D%22Arial%22%20font-size%3D%2214%22%20text-anchor%3D%22middle%22%20x%3D%22273.5%22%20y%3D%2214%22%3Eprice%3C%2Ftext%3E%3C%2Fsvg%3E)
-
Sales revenue increases as the sales volume increases
-
Costs
-
In preparing goods and services for sale, businesses incur a range of costs
-
Some examples of these costs include purchasing raw materials, paying staff salaries and wages and paying utility bills, such as electricity
-
-
These costs can be broken into different categories
-
Fixed costs (FC) are costs that do not change as the level of output changes
-
These have to be paid whether the output is zero or 5,000
-
-
Variable costs (VC) are costs that vary directly with the output
-
These increase as output increases and vice versa
-
-
Total costs (TC) are the sum of the fixed and variable costs
-
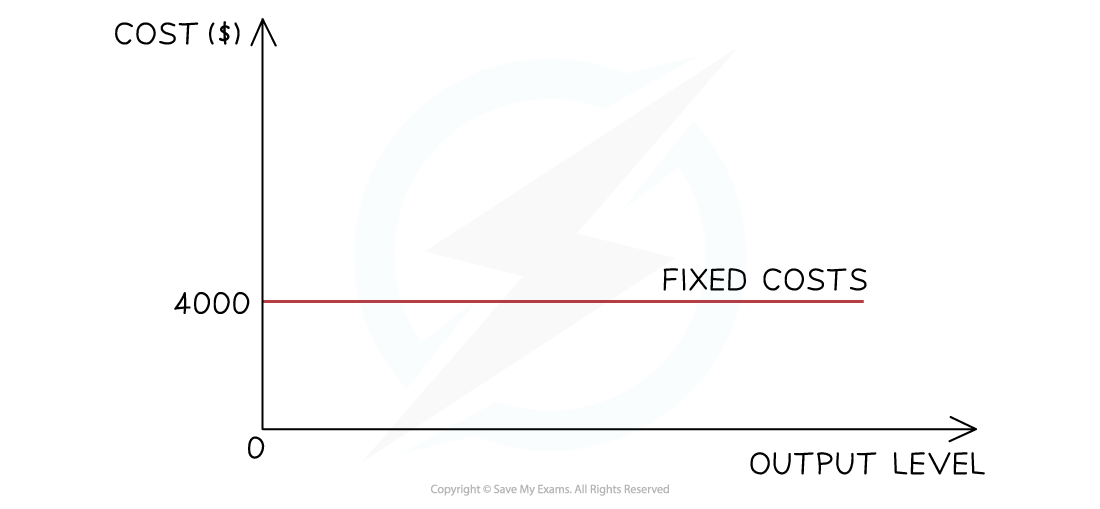
Fixed costs
-
The firm has to pay its fixed costs, which do not change, irrespective of whether the output is zero or 100,000 units
-
The fixed costs for this firm are $4,000
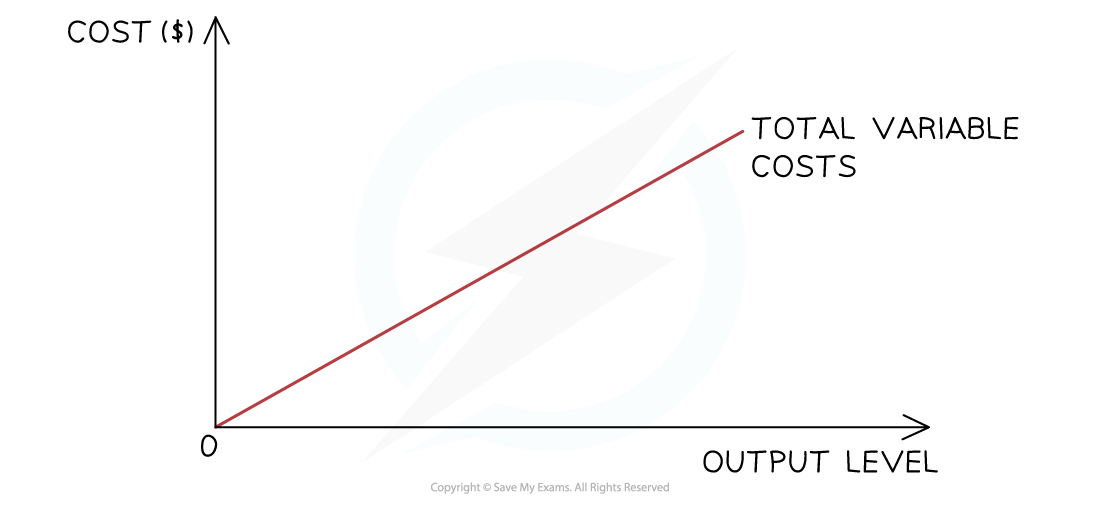
Variable costs
-
The variable costs initially rise proportionally with output, as shown in the diagram
-
At some point, the firm will benefit from a purchasing economy of scale, and the rise will no longer be proportional
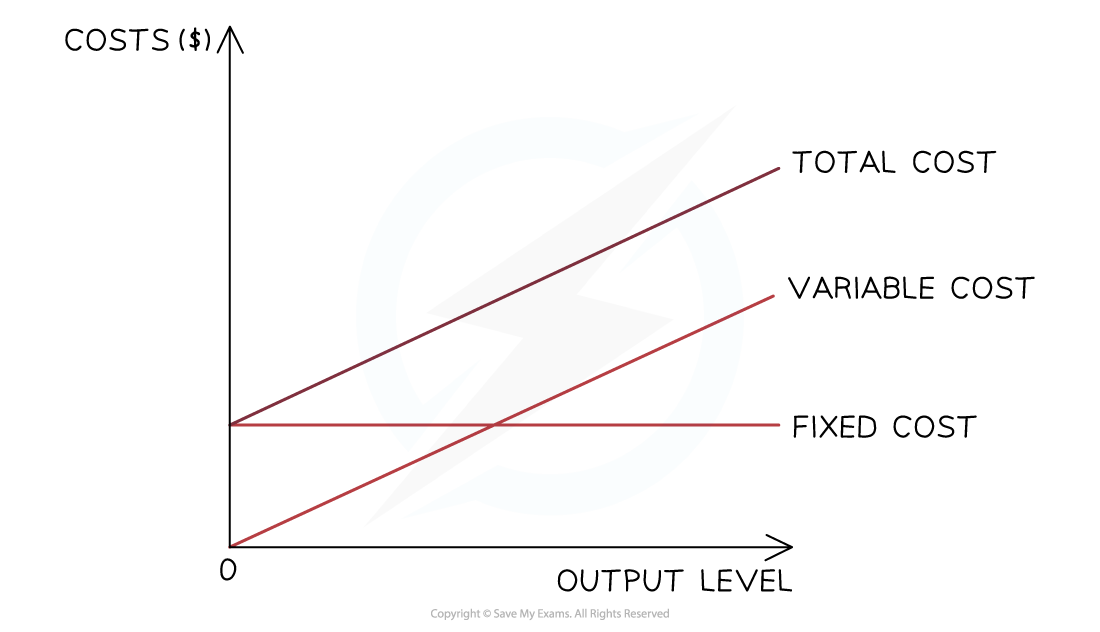
Total costs
-
The total costs are the sum of the variable and fixed costs at each level of output
-
Total costs cannot be zero, as all firms have some level of fixed costs
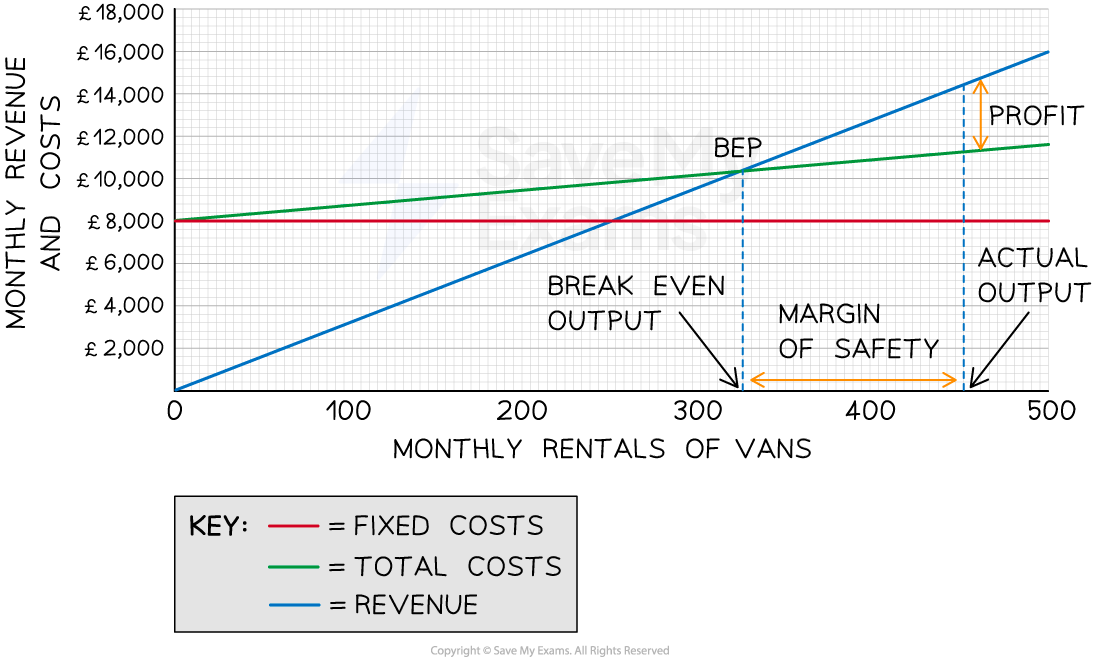
Constructing and interpreting breakeven charts
-
A breakeven chart is a visual representation of the breakeven point and is used to identify the following:
-
Fixed costs, total costs and revenue over a range of output
-
The breakeven point — where total costs are equal to revenue
-
Profit or loss made at each level of output
-
The margin of safety
-
Diagram: Breakeven chart
Responses