
Biology_Edexcel_A-snab_Alevel
-
the-circulatory-system8 主题
-
diet-and-health11 主题
-
gas-exchange-cell-membranes-and-transport8 主题
-
nucleic-acids3 主题
-
proteins10 主题
-
inheritance7 主题
-
cell-structure-and-organisation7 主题
-
cell-division3 主题
-
reproduction-and-inheritance4 主题
-
differentiation-and-variation5 主题
-
biodiversity9 主题
-
resources-from-plants10 主题
-
plant-cell-structure
-
plant-stems
-
importance-of-water-and-inorganic-ions-to-plants
-
starch-and-cellulose-structure-and-function
-
plant-fibres
-
practical-identifying-tissue-types-within-stems
-
tensile-strength-plant-fibres
-
development-of-drug-testing
-
antimicrobial-properties-of-plants
-
sustainability-and-plant-materials
-
plant-cell-structure
-
ecosystems-and-energy-transfer7 主题
-
photosynthesis7 主题
-
climate-change10 主题
-
the-effects-of-climate-change
-
temperature-and-enzyme-activity
-
practical-temperature-and-development-of-organisms
-
climate-change-and-the-scientific-community
-
carbon-cycle-and-reduction-of-atmospheric-carbon-dioxide
-
reducing-climate-change
-
introduction-to-climate-change
-
evidence-for-the-causes-of-climate-change
-
the-greenhouse-effect
-
models-of-future-climate-change
-
the-effects-of-climate-change
-
evolution3 主题
-
forensics3 主题
-
microorganisms-and-immunity11 主题
-
muscles-and-movement3 主题
-
respiration7 主题
-
homeostasis4 主题
-
exercise4 主题
-
response-to-the-environment8 主题
-
the-brain-behaviour-and-disease10 主题
practical-investigating-the-effects-of-exercise
Practical: Investigating the Effects of Exercise
Measuring breathing
-
There are four main ways that breathing can be scientifically measured. These include:
-
Tidal volume – this is the volume of air that is breathed in or out during normal breathing (at rest)
-
Breathing rate – this is the number of breaths taken in one minute (one breath = taking air in and breathing it back out again)
-
Oxygen consumption – this is the volume of oxygen used up by someone in a given time
-
Respiratory minute ventilation – this is the volume of air that can be breathed in or out in a minute and can be calculated by means of the following formulae:
-
Respiratory minute ventilation = tidal volume x breathing rate (breaths per minute)
Spirometers
-
The breathing measurements described above can all be made using a piece of apparatus known as a spirometer
-
The person (subject) being examined breathes in and out through the spirometer
-
Carbon dioxide is absorbed from the exhaled air by soda lime in order to stop the concentration of carbon dioxide in the re-breathed air from getting too high, as this can cause breathing distress
-
As the subject breathes through the spirometer, a trace is drawn on a rotating drum of paper or a graph is formed digitally, which can be viewed on a computer
-
From this trace, the subject’s respiratory minute ventilation, tidal volume and breathing rate can all be calculated


Spirometers are used to measure different aspects of breathing. There are different types of spirometers
Investigating the effects of exercise
-
Exercise can cause an increase in breathing rate and tidal volume, including an increase in oxygen consumption and ventilation rates.
Apparatus
-
Spirometer
-
Treadmill
-
Stopwatch
Method
-
A person at rest will breathe into the spirometer for one minute
-
Record the results
-
The person will then exercise for two minutes while the spirometer chamber is refilled with oxygen
-
After they stop exercising, they will immediately breathe into the spirometer for one minute
-
Record the results
-
Compare the recordings taken before and after exercising
Analysing data from a spirometer
-
The results from a spirometer (either in the form of a trace drawn on graph paper or a digital graph created by a computer) can be used to calculate respiratory minute ventilation, tidal volume and breathing rate
-
A small amount of air, known as the residual volume, is always retained in the lungs
-
-
The following readings and calculations can be made:
-
To calculate the breathing rate, count the number of peaks on the trace in a minute
-
Tidal volume can be determined by calculating the average difference in the volume of gas between each peak and trough
-
Oxygen consumption can also be calculated using a spirometer
-
Carbon dioxide is removed from the exhaled air, meaning that the total volume of air available in the spirometer gradually decreases, as oxygen is extracted from it by the subject’s breathing
-
This change in volume is used as a measure of oxygen consumption
-
-

The changes in the volume of air present in the lungs are shown here. Note the vital capacity, this is the maximum volume of air that can be breathed in or out in one breath
Worked Example
From the spirometer data in the image above, calculate the breathing rate during the first minute and then calculate the breathing rate during the second minute.
Answer:
Step One: Count the number of breaths in the first 60 seconds.
One breath is shown by the trace going up and then down, so there are 12 breaths in the first 60 seconds.
Step Two: Give appropriate units.
Breathing rate should be given in breaths min⁻¹ (breaths per minute), so the breathing rate during the first minute
= 12 breaths min⁻¹.
Step Three: Count the number of breaths in the second 60 seconds.
There are 14 breaths in the second 60 seconds.
Step Four: Give appropriate units.
The breathing rate during the second minute = 14 breaths min⁻¹.
Worked Example
Calculate the tidal volume during rest and the peak tidal volume during exercise.
Answer:
Step One: For the ‘at rest’ phase of the trace, measure the difference between the top and bottom of the trace in terms of the volume of air in the lungs.
During rest, the tidal volume = 3 dm³ – 2.6 dm³
= 0.4 dm³
Step Two: At the peak tidal volume during exercise, measure the difference between the top and bottom of the trace in terms of the volume of air in the lungs.
The peak tidal volume during exercise occurs right at the end of the exercise period (at around 100 seconds):
= 4.1 dm³ – 2.3 dm³
= 1.8 dm³
Worked Example
Calculate the respiratory minute ventilation during the first minute.
Answer:
Step One: Use the formula
Respiratory minute ventilation = tidal volume x breathing rate
Step Two: Substitute the values calculated from the first minute
Respiratory minute ventilation = 0.4 x 12
= 4.8 dm3 min-1
Using a t-test to compare two sets of data
-
You can use a Student’s t-test to determine, for example, whether exercise has a significant effect on the tidal volume of people at rest
-
To do a t-test, you will need two sets of data for which the means/average must be calculated
-
The value determined from a t-test will be compared to a critical value to see if the differences in the means were likely due to chance or not
-
A null hypothesis should be given
-
This is a statement of what we would expect if there is no significant difference between two means, and that any differences seen are due to chance
-
-
If there is a statistically significant difference between the means of two sets of data, then the observation is not down to chance and the null hypothesis can be rejected
-
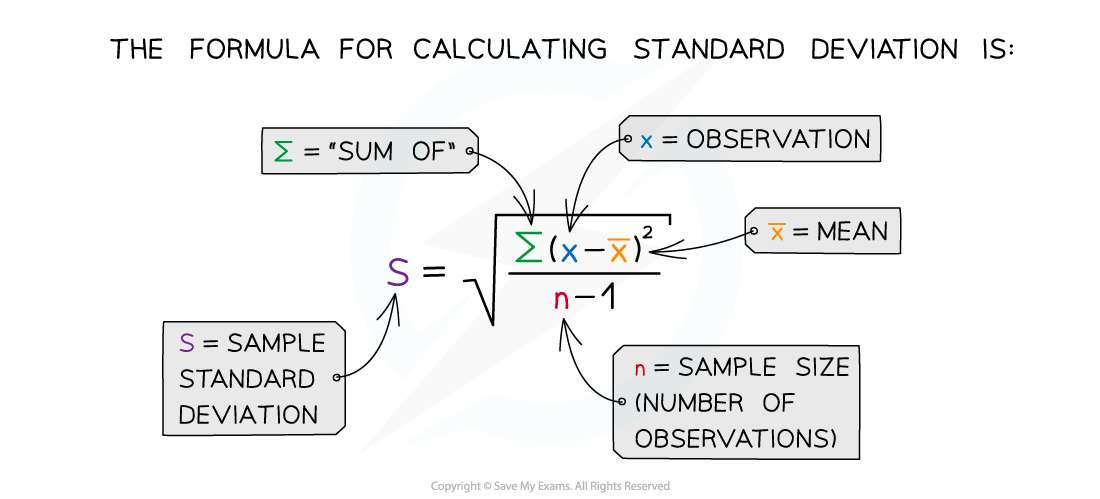
The next step is to calculate the standard deviation
Using the t-test to compare two means
-
The steps below outline the general steps in a t test; for a worked example see the next page
-
Null hypothesis: there is no statistically significant difference between the means of sample 1 and sample 2
-
Step 1: Calculate the mean for each data set:
-
Step 2: Calculate the standard deviation for each set of data, s1 = standard deviation of sample 1 and s2 = standard deviation of sample 2