
Biology_Alevel_Ocr
-
4-1-communicable-diseases-disease-prevention-and-the-immune-system16 主题
-
4-1-1-common-pathogens-and-communicable-diseases
-
4-1-2-transmission-of-communicable-pathogens
-
4-1-3-plant-defences-against-pathogens
-
4-1-4-non-specific-immune-responses
-
4-1-5-phagocytes
-
4-1-6-blood-cells
-
4-1-7-the-t-lymphocyte-response
-
4-1-8-the-b-lymphocyte-response
-
4-1-9-primary-and-secondary-immune-responses
-
4-1-10-antibodies
-
4-1-11-opsonins-agglutinins-and-anti-toxins
-
4-1-12-types-of-immunity
-
4-1-13-autoimmune-diseases
-
4-1-14-principles-of-vaccination
-
4-1-15-sources-of-medicine
-
4-1-16-antibiotics
-
4-1-1-common-pathogens-and-communicable-diseases
-
4-2-biodiversity10 主题
-
4-2-1-biodiversity
-
4-2-2-sampling-to-determine-biodiversity
-
4-2-3-practical-investigating-biodiversity-using-sampling
-
4-2-4-measuring-species-richness-and-species-evenness
-
4-2-5-simpsons-index
-
4-2-6-genetic-diversity
-
4-2-7-factors-affecting-biodiversity
-
4-2-8-reasons-for-maintaining-biodiversity
-
4-2-9-methods-of-maintaining-biodiversity
-
4-2-10-conservation-agreements
-
4-2-1-biodiversity
-
4-3-classification-and-evolution15 主题
-
4-3-1-classification-of-species
-
4-3-2-binomial-system
-
4-3-3-classification-of-the-three-domains
-
4-3-4-classification-of-the-five-kingdoms
-
4-3-5-classification-and-phylogeny
-
4-3-6-evidence-of-evolution
-
4-3-7-types-of-variation
-
4-3-8-standard-deviation
-
4-3-9-variation-t-test-method
-
4-3-10-variation-t-test-worked-example
-
4-3-11-spearmans-rank-correlation
-
4-3-12-adaptation
-
4-3-13-natural-selection
-
4-3-14-evolution-of-resistance
-
4-3-15-consequences-of-resistance
-
4-3-1-classification-of-species
-
5-1-communication-and-homeostasis4 主题
-
5-2-excretion10 主题
-
5-2-1-the-importance-of-excretion
-
5-2-2-the-mammalian-liver-structure
-
5-2-3-the-mammalian-liver-function
-
5-2-4-the-liver-under-the-microscope
-
5-2-5-the-mammalian-kidney-structure
-
5-2-6-the-mammalian-kidney-function
-
5-2-7-the-kidney-under-the-microscope
-
5-2-8-osmoregulation
-
5-2-9-kidney-failure
-
5-2-10-excretory-products-and-medical-diagnosis
-
5-2-1-the-importance-of-excretion
-
5-3-neuronal-communication9 主题
-
5-4-hormonal-communication4 主题
-
5-5-plant-and-animal-responses16 主题
-
5-5-1-plant-responses
-
5-5-2-investigating-phototropism-and-geotropism
-
5-5-3-plant-hormones
-
5-5-4-auxins-and-apical-dominance
-
5-5-5-gibberellin
-
5-5-6-practical-effect-of-plant-hormones-on-growth
-
5-5-7-commercial-use-of-plant-hormones
-
5-5-8-mammalian-nervous-system
-
5-5-9-the-human-brain
-
5-5-10-reflex-actions
-
5-5-11-coordination-of-responses
-
5-5-12-factors-affecting-heart-rate
-
5-5-13-investigating-factors-affecting-heart-rate
-
5-5-14-mammalian-muscle-structure
-
5-5-15-transmission-across-a-neuromuscular-junction
-
5-5-16-the-sliding-filament-model
-
5-5-1-plant-responses
-
5-6-photosynthesis10 主题
-
5-6-1-photosynthesis-and-respiration
-
5-6-2-chloroplast-structure-and-function
-
5-6-3-photosynthetic-pigments
-
5-6-4-practical-investigating-photosynthetic-pigments-with-chromatography
-
5-6-5-the-light-dependent-stage
-
5-6-6-using-the-products-of-the-light-dependent-reaction
-
5-6-7-the-light-independent-stage
-
5-6-8-uses-of-triose-phosphate
-
5-6-9-factors-affecting-the-rate-of-photosynthesis
-
5-6-10-practical-investigating-factors-affecting-the-rate-of-photosynthesis
-
5-6-1-photosynthesis-and-respiration
-
5-7-respiration14 主题
-
5-7-14-practical-respirometer
-
5-7-1-the-need-for-cellular-respiration
-
5-7-2-structure-of-the-mitochondrion
-
5-7-3-the-four-stages-in-aerobic-respiration
-
5-7-4-glycolysis
-
5-7-5-the-link-reaction
-
5-7-6-the-krebs-cycle
-
5-7-7-the-role-of-coenzymes
-
5-7-8-oxidative-phosphorylation
-
5-7-9-anaerobic-respiration
-
5-7-10-energy-yield-of-aerobic-vs-anaerobic-respiration
-
5-7-11-practical-investigating-the-rate-of-respiration
-
5-7-12-respiratory-substrates
-
5-7-13-respiratory-quotient-rq
-
5-7-14-practical-respirometer
-
6-1-cellular-control7 主题
-
6-2-patterns-of-inheritance13 主题
-
6-2-1-key-terms-in-genetics
-
6-2-2-variation-phenotype
-
6-2-3-variation-sexual-reproduction
-
6-2-4-predicting-inheritance-monohybrid-crosses
-
6-2-5-predicting-inheritance-dihybrid-crosses
-
6-2-6-predicting-inheritance-identifying-linkage
-
6-2-7-predicting-inheritance-identifying-epistasis
-
6-2-8-predicting-inheritance-chi-squared-test
-
6-2-9-continuous-and-discontinuous-variation
-
6-2-10-factors-affecting-evolution
-
6-2-11-the-hardy-weinberg-principle
-
6-2-12-isolation-and-speciation
-
6-2-13-artificial-selection
-
6-2-1-key-terms-in-genetics
-
6-3-manipulating-genomes11 主题
-
6-3-1-dna-sequencing
-
6-3-2-comparing-genomes
-
6-3-3-non-coding-dna-and-regulatory-genes
-
6-3-4-synthetic-biology
-
6-3-5-polymerase-chain-reaction
-
6-3-6-electrophoresis
-
6-3-7-dna-profiling
-
6-3-8-genetic-engineering
-
6-3-9-genetic-engineering-techniques
-
6-3-10-uses-of-genetic-engineering
-
6-3-11-gene-therapy
-
6-3-1-dna-sequencing
-
6-4-cloning-and-biotechnology14 主题
-
6-4-1-natural-clones-in-plants
-
6-4-2-producing-cuttings
-
6-4-3-production-of-artificial-clones-in-plants
-
6-4-4-uses-of-plant-cloning
-
6-4-5-natural-clones-in-animals
-
6-4-6-production-of-artificial-clones-in-animals
-
6-4-7-uses-of-animal-cloning
-
6-4-8-microorganisms-and-biotechnology
-
6-4-9-microorganisms-and-food-production
-
6-4-10-culturing-microorganisms
-
6-4-11-batch-and-continuous-fermentation
-
6-4-12-standard-growth-curve-of-microorganisms
-
6-4-13-factors-affecting-the-growth-of-microorganisms
-
6-4-14-immobilised-enzymes-in-biotechnology
-
6-4-1-natural-clones-in-plants
-
6-5-ecosystems7 主题
-
6-6-populations-and-sustainability6 主题
-
1-1-practical-skills-written-assessment7 主题
-
1-2-practical-skills-endorsement-assessment16 主题
-
1-2-1-practical-ethical-use-of-organisms
-
1-2-2-practical-aseptic-techniques
-
1-2-3-practical-dissection-of-gas-exchange-surfaces-in-fish-and-insects
-
1-2-4-drawing-cells-from-blood-smears
-
1-2-5-practical-investigating-biodiversity-using-sampling
-
1-2-6-practical-data-loggers-and-computer-modelling
-
1-2-7-practical-investigating-the-rate-of-diffusion
-
1-2-8-practical-investigating-water-potential
-
1-2-9-practical-factors-affecting-membrane-structure-and-permeability
-
1-2-10-biochemical-tests-reducing-sugars-and-starch
-
1-2-11-biochemical-tests-lipids
-
1-2-12-biochemical-tests-proteins
-
1-2-13-chromatography
-
1-2-14-serial-dilutions
-
1-2-15-practical-investigating-the-rate-of-transpiration
-
1-2-16-practical-using-a-light-microscope
-
1-2-1-practical-ethical-use-of-organisms
-
2-1-cell-structure9 主题
-
2-2-biological-molecules17 主题
-
2-2-1-properties-of-water
-
2-2-2-monomers-and-polymers
-
2-2-3-monosaccharides
-
2-2-4-the-glycosidic-bond
-
2-2-5-polysaccharides
-
2-2-6-biochemical-tests-reducing-sugars-and-starch
-
2-2-7-lipids-and-ester-bonds
-
2-2-8-lipids-structure-and-function
-
2-2-9-biochemical-tests-lipids
-
2-2-10-amino-acids-and-peptide-bonds
-
2-2-11-protein-structure
-
2-2-12-globular-proteins
-
2-2-13-fibrous-proteins
-
2-2-14-inorganic-ions
-
2-2-15-biochemical-tests-proteins
-
2-2-16-finding-the-concentration-of-a-substance
-
2-2-17-chromatography
-
2-2-1-properties-of-water
-
2-3-nucleotides-and-nucleic-acids8 主题
-
2-4-enzymes9 主题
-
2-4-1-the-role-of-enzymes
-
2-4-2-enzyme-action
-
2-4-3-enzyme-activity-ph
-
2-4-4-enzyme-activity-temperature
-
2-4-5-enzyme-activity-enzyme-concentration
-
2-4-6-enzyme-activity-substrate-concentration
-
2-4-7-enzyme-activity-enzyme-inhibitors
-
2-4-8-coenzymes-cofactors-and-prosthetic-groups
-
2-4-9-practical-measuring-enzyme-activity
-
2-4-1-the-role-of-enzymes
-
2-5-biological-membranes9 主题
-
2-5-1-the-cell-surface-membrane
-
2-5-2-membrane-structure-and-permeability
-
2-5-3-diffusion-and-facilitated-diffusion
-
2-5-4-practical-investigating-the-rate-of-diffusion
-
2-5-5-active-transport
-
2-5-6-endocytosis-and-exocytosis
-
2-5-7-osmosis
-
2-5-8-osmosis-in-animal-and-plant-cells
-
2-5-9-practical-investigating-water-potential
-
2-5-1-the-cell-surface-membrane
-
2-6-cell-division-cell-diversity-and-cellular-organisation11 主题
-
2-6-1-the-cell-cycle
-
2-6-2-the-stages-of-mitosis
-
2-6-3-identifying-mitosis-in-plant-cells
-
2-6-4-the-significance-of-mitosis
-
2-6-5-the-stages-of-meiosis
-
2-6-6-the-significance-of-meiosis
-
2-6-7-specialised-cells
-
2-6-8-the-organisation-of-cells
-
2-6-9-stem-cells
-
2-6-10-stem-cells-in-animals-and-plants
-
2-6-11-the-use-of-stem-cells
-
2-6-1-the-cell-cycle
-
3-1-exchange-surfaces7 主题
-
3-2-transport-in-animals12 主题
-
3-2-1-the-need-for-transport-systems-in-animals
-
3-2-2-circulatory-systems
-
3-2-3-blood-vessels
-
3-2-4-tissue-fluid
-
3-2-5-the-mammalian-heart
-
3-2-6-practical-mammalian-heart-dissection
-
3-2-7-the-cardiac-cycle
-
3-2-8-cardiac-output
-
3-2-9-heart-action-initiation-and-control
-
3-2-10-electrocardiograms-ecgs
-
3-2-11-the-role-of-haemoglobin
-
3-2-12-adult-and-fetal-haemoglobin
-
3-2-1-the-need-for-transport-systems-in-animals
-
3-3-transport-in-plants11 主题
-
3-3-1-the-need-for-transport-systems-in-plants
-
3-3-2-the-xylem-and-phloem
-
3-3-3-the-xylem
-
3-3-4-the-phloem
-
3-3-5-transverse-sections-stems-roots-and-leaves
-
3-3-6-the-process-of-transpiration
-
3-3-7-transpiration-in-plants
-
3-3-8-practical-investigating-the-rate-of-transpiration
-
3-3-9-translocation
-
3-3-10-the-mass-flow-hypothesis
-
3-3-11-the-adaptations-of-xerophytic-and-hydrophytic-plants
-
3-3-1-the-need-for-transport-systems-in-plants
4-3-10-variation-t-test-worked-example
Variation: t-test worked example
-
The t test method can be used to determine whether the means of two data sets are significantly different
Worked Example
The ear lengths of two populations of rabbits were measured.
Ear lengths of population A (mm):
62, 60, 59, 61, 60, 58, 59, 60, 57, 56, 59, 58, 60, 59, 57
Ear lengths of population B (mm):
58, 59, 57, 59, 59, 57, 55, 60, 57, 58, 59, 58, 57, 58, 59
Use the t-test to determine whether there is a significant difference in ear length between the two populations.
-
Null hypothesis: There is no significant difference between the ear lengths of the rabbits in populations A and B
-
Sample sizes:
-
Population A: n1 = 15
-
Population B: n2 = 15
-
Step 1: calculate the mean for each data set:
Mean for population A x̅1 = 885 ÷ 15 = 59 mm
Mean for population B x̅2 = 870 ÷ 15 = 58 mm
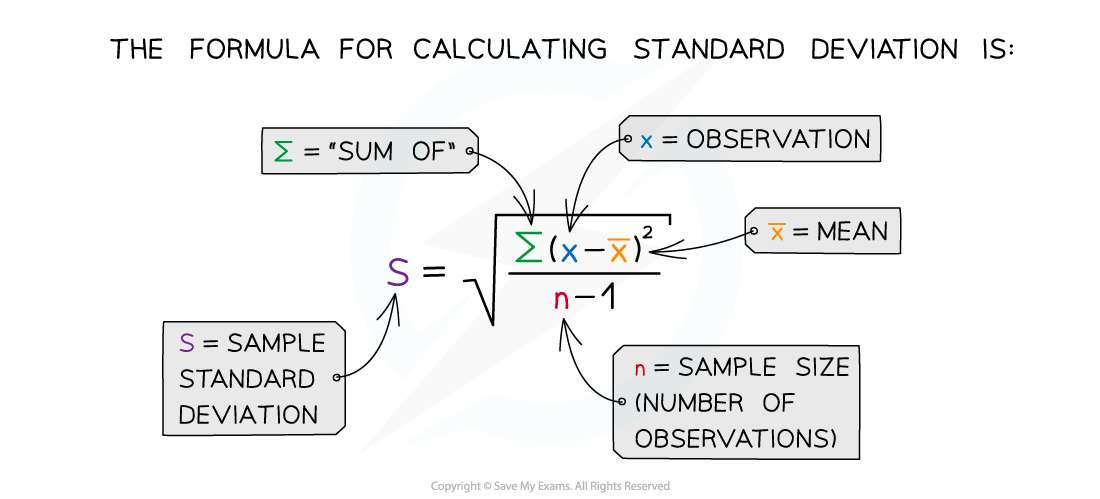
Step 2: calculate the standard deviation (s) for each data set
-
Calculate ∑(x – x̄)2
|
Population A |
Population B |
||
|---|---|---|---|
|
Difference between value and mean (x – x̄) |
Difference between value and mean squared (x – x̄)2 |
Difference between value and mean (x – x̄) |
Difference between value and mean squared (x – x̄)2 |
|
62 – 59 = 3 |
9 |
58 – 58 = 0 |
0 |
|
60 – 59 = 1 |
1 |
59 – 58 = 1 |
1 |
|
59 – 59 = 0 |
0 |
57 – 58 = -1 |
1 |
|
61 – 59 = 2 |
4 |
59 – 58 = 1 |
1 |
|
60 – 59 = 1 |
1 |
59 – 58 = 1 |
1 |
|
58 – 59 = -1 |
1 |
57 – 58 = -1 |
1 |
|
59 – 59 = 0 |
0 |
55 – 58 = -3 |
9 |
|
60 – 59 = 1 |
1 |
60 – 58 = 2 |
4 |
|
57 – 59 = -2 |
4 |
57 – 58 = -1 |
1 |
|
56 – 59 = -3 |
9 |
58 – 58 = 0 |
0 |
|
59 – 59 = 0 |
0 |
59 – 58 = 1 |
1 |
|
58 – 59 = -1 |
1 |
58 – 58 = 0 |
0 |
|
60 – 59 = 1 |
1 |
57 – 58 = -1 |
1 |
|
59 – 59 = 0 |
0 |
58 – 58 = 0 |
0 |
|
57 – 59 = -2 |
4 |
59 – 58 = 1 |
1 |
|
Total ∑(x – x̄)2 |
36 |
Total ∑(x – x̄)2 |
22 |
-
Calculate
format('truetype')%3Bfont-weight%3Anormal%3Bfont-style%3Anormal%3B%7D%40font-face%7Bfont-family%3A'math1170fb7cccdb038d7a2b41a387f'%3Bsrc%3Aurl(data%3Afont%2Ftruetype%3Bcharset%3Dutf-8%3Bbase64%2CAAEAAAAMAIAAAwBAT1MvMi7iBBMAAADMAAAATmNtYXDEvmKUAAABHAAAADxjdnQgDVUNBwAAAVgAAAA6Z2x5ZoPi2VsAAAGUAAAA%2B2hlYWQQC2qxAAACkAAAADZoaGVhCGsXSAAAAsgAAAAkaG10eE2rRkcAAALsAAAADGxvY2EAHTwYAAAC%2BAAAABBtYXhwBT0FPgAAAwgAAAAgbmFtZaBxlY4AAAMoAAABn3Bvc3QB9wD6AAAEyAAAACBwcmVwa1uragAABOgAAAAUAAADSwGQAAUAAAQABAAAAAAABAAEAAAAAAAAAQEAAAAAAAAAAAAAAAAAAAAAAAAAAAAAAAAAAAAAACAgICAAAAAg1UADev96AAAD6ACWAAAAAAACAAEAAQAAABQAAwABAAAAFAAEACgAAAAGAAQAAQACIhEiEv%2F%2FAAAiESIS%2F%2F%2Fd8N3wAAEAAAAAAAAAAAFUAywAgAEAAFYAKgJYAh4BDgEsAiwAWgGAAoAAoADUAIAAAAAAAAAAKwBVAIAAqwDVAQABKwAHAAAAAgBVAAADAAOrAAMABwAAMxEhESUhESFVAqv9qwIA%2FgADq%2FxVVQMAAAEAgAAAAysDKwAPAEoYAbAQELEEA%2FawADyxCQP1sAs8sQYL9bAOPLERA%2BaxBwb9sA08ALEEAD%2BxCAX9sQMJPDyxBgXtsQACP7EMBf2xCwE8PLEOBf0xMBMVCQEVITUjFSEJASEVMzWAASv%2B1QKrK%2F4AASv%2B1QIAKwMrVf7%2F%2FoBVq1YBgAEBVqsAAQCAAVUC1QGrAAMAMBgBsAQQsQAD9rADPLECB%2FWwATyxBQPmALEAABMQsQAG5bEAARMQsAE8sQMF9bACPBMhFSGAAlX9qwGrVgAAAQAAAAEAANV4zkFfDzz1AAMEAP%2F%2F%2F%2F%2FWOhNz%2F%2F%2F%2F%2F9Y6E3MAAP8gBIADqwAAAAoAAgABAAAAAAABAAAD6P9qAAAXcAAA%2F7YEgAABAAAAAAAAAAAAAAAAAAAAAwNSAFUDrACAA1YAgAAAAAAAAAAoAAAAsQAAAPsAAQAAAAMAXgAFAAAAAAACAIAEAAAAAAAEAADeAAAAAAAAABUBAgAAAAAAAAABABIAAAAAAAAAAAACAA4AEgAAAAAAAAADADAAIAAAAAAAAAAEABIAUAAAAAAAAAAFABYAYgAAAAAAAAAGAAkAeAAAAAAAAAAIABwAgQABAAAAAAABABIAAAABAAAAAAACAA4AEgABAAAAAAADADAAIAABAAAAAAAEABIAUAABAAAAAAAFABYAYgABAAAAAAAGAAkAeAABAAAAAAAIABwAgQADAAEECQABABIAAAADAAEECQACAA4AEgADAAEECQADADAAIAADAAEECQAEABIAUAADAAEECQAFABYAYgADAAEECQAGAAkAeAADAAEECQAIABwAgQBNAGEAdABoACAARgBvAG4AdABSAGUAZwB1AGwAYQByAE0AYQB0AGgAcwAgAEYAbwByACAATQBvAHIAZQAgAE0AYQB0AGgAIABGAG8AbgB0AE0AYQB0AGgAIABGAG8AbgB0AFYAZQByAHMAaQBvAG4AIAAxAC4AME1hdGhfRm9udABNAGEAdABoAHMAIABGAG8AcgAgAE0AbwByAGUAAAMAAAAAAAAB9AD6AAAAAAAAAAAAAAAAAAAAAAAAAAC5BxEAAI2FGACyAAAAFRQTsQABPw%3D%3D)format('truetype')%3Bfont-weight%3Anormal%3Bfont-style%3Anormal%3B%7D%40font-face%7Bfont-family%3A'round_brackets18549f92a457f2409'%3Bsrc%3Aurl(data%3Afont%2Ftruetype%3Bcharset%3Dutf-8%3Bbase64%2CAAEAAAAMAIAAAwBAT1MvMjwHLFQAAADMAAAATmNtYXDf7xCrAAABHAAAADxjdnQgBAkDLgAAAVgAAAASZ2x5ZmAOz2cAAAFsAAABJGhlYWQOKih8AAACkAAAADZoaGVhCvgVwgAAAsgAAAAkaG10eCA6AAIAAALsAAAADGxvY2EAAARLAAAC%2BAAAABBtYXhwBIgEWQAAAwgAAAAgbmFtZXHR30MAAAMoAAACOXBvc3QDogHPAAAFZAAAACBwcmVwupWEAAAABYQAAAAHAAAGcgGQAAUAAAgACAAAAAAACAAIAAAAAAAAAQIAAAAAAAAAAAAAAAAAAAAAAAAAAAAAAAAAAAAAACAgICAAAAAo8AMGe%2F57AAAHPgGyAAAAAAACAAEAAQAAABQAAwABAAAAFAAEACgAAAAGAAQAAQACACgAKf%2F%2FAAAAKAAp%2F%2F%2F%2F2f%2FZAAEAAAAAAAAAAAFUAFYBAAAsAKgDgAAyAAcAAAACAAAAKgDVA1UAAwAHAAA1MxEjEyMRM9XVq4CAKgMr%2FQAC1QABAAD%2B0AIgBtAACQBNGAGwChCwA9SwAxCwAtSwChCwBdSwBRCwANSwAxCwBzywAhCwCDwAsAoQsAPUsAMQsAfUsAoQsAXUsAoQsADUsAMQsAI8sAcQsAg8MTAREAEzABEQASMAAZCQ%2FnABkJD%2BcALQ%2FZD%2BcAGQAnACcAGQ%2FnAAAQAA%2FtACIAbQAAkATRgBsAoQsAPUsAMQsALUsAoQsAXUsAUQsADUsAMQsAc8sAIQsAg8ALAKELAD1LADELAH1LAKELAF1LAKELAA1LADELACPLAHELAIPDEwARABIwAREAEzAAIg%2FnCQAZD%2BcJABkALQ%2FZD%2BcAGQAnACcAGQ%2FnAAAQAAAAEAAPW2NYFfDzz1AAMIAP%2F%2F%2F%2F%2FVre7u%2F%2F%2F%2F%2F9Wt7u4AAP7QA7cG0AAAAAoAAgABAAAAAAABAAAHPv5OAAAXcAAA%2F%2F4DtwABAAAAAAAAAAAAAAAAAAAAAwDVAAACIAAAAiAAAAAAAAAAAAAkAAAAowAAASQAAQAAAAMACgACAAAAAAACAIAEAAAAAAAEAABNAAAAAAAAABUBAgAAAAAAAAABAD4AAAAAAAAAAAACAA4APgAAAAAAAAADAFwATAAAAAAAAAAEAD4AqAAAAAAAAAAFABYA5gAAAAAAAAAGAB8A%2FAAAAAAAAAAIABwBGwABAAAAAAABAD4AAAABAAAAAAACAA4APgABAAAAAAADAFwATAABAAAAAAAEAD4AqAABAAAAAAAFABYA5gABAAAAAAAGAB8A%2FAABAAAAAAAIABwBGwADAAEECQABAD4AAAADAAEECQACAA4APgADAAEECQADAFwATAADAAEECQAEAD4AqAADAAEECQAFABYA5gADAAEECQAGAB8A%2FAADAAEECQAIABwBGwBSAG8AdQBuAGQAIABiAHIAYQBjAGsAZQB0AHMAIAB3AGkAdABoACAAYQBzAGMAZQBuAHQAIAAxADgANQA0AFIAZQBnAHUAbABhAHIATQBhAHQAaABzACAARgBvAHIAIABNAG8AcgBlACAAUgBvAHUAbgBkACAAYgByAGEAYwBrAGUAdABzACAAdwBpAHQAaAAgAGEAcwBjAGUAbgB0ACAAMQA4ADUANABSAG8AdQBuAGQAIABiAHIAYQBjAGsAZQB0AHMAIAB3AGkAdABoACAAYQBzAGMAZQBuAHQAIAAxADgANQA0AFYAZQByAHMAaQBvAG4AIAAyAC4AMFJvdW5kX2JyYWNrZXRzX3dpdGhfYXNjZW50XzE4NTQATQBhAHQAaABzACAARgBvAHIAIABNAG8AcgBlAAAAAAMAAAAAAAADnwHPAAAAAAAAAAAAAAAAAAAAAAAAAAC5B%2F8AAY2FAA%3D%3D)format('truetype')%3Bfont-weight%3Anormal%3Bfont-style%3Anormal%3B%7D%3C%2Fstyle%3E%3C%2Fdefs%3E%3Cpolyline%20fill%3D%22none%22%20points%3D%2214%2C-57%2013%2C-57%206%2C0%202%2C-23%22%20stroke%3D%22%23000%22%20stroke-linecap%3D%22square%22%20stroke-width%3D%221%22%20transform%3D%22translate(0.5%2C60.5)%22%2F%3E%3Cpolyline%20fill%3D%22none%22%20points%3D%226%2C0%202%2C-23%201%2C-20%22%20stroke%3D%22%23000%22%20stroke-linecap%3D%22square%22%20stroke-width%3D%221%22%20transform%3D%22translate(0.5%2C60.5)%22%2F%3E%3Cline%20stroke%3D%22%23000%22%20stroke-linecap%3D%22square%22%20stroke-width%3D%221%22%20x1%3D%2214.5%22%20x2%3D%22106.5%22%20y1%3D%223.5%22%20y2%3D%223.5%22%2F%3E%3Cline%20stroke%3D%22%23000%22%20stroke-linecap%3D%22square%22%20stroke-width%3D%221%22%20x1%3D%2218.5%22%20x2%3D%22102.5%22%20y1%3D%2239.5%22%20y2%3D%2239.5%22%2F%3E%3Ctext%20font-family%3D%22math1170fb7cccdb038d7a2b41a387f%22%20font-size%3D%2224%22%20text-anchor%3D%22middle%22%20x%3D%2231.5%22%20y%3D%2227%22%3E%26%23x2211%3B%3C%2Ftext%3E%3Ctext%20font-family%3D%22round_brackets18549f92a457f2409%22%20font-size%3D%2218%22%20text-anchor%3D%22middle%22%20x%3D%2250.5%22%20y%3D%2224%22%3E(%3C%2Ftext%3E%3Ctext%20font-family%3D%22round_brackets18549f92a457f2409%22%20font-size%3D%2218%22%20text-anchor%3D%22middle%22%20x%3D%2290.5%22%20y%3D%2224%22%3E)%3C%2Ftext%3E%3Ctext%20font-family%3D%22Times%20New%20Roman%22%20font-size%3D%2218%22%20text-anchor%3D%22middle%22%20x%3D%2257.5%22%20y%3D%2224%22%3Ex%3C%2Ftext%3E%3Ctext%20font-family%3D%22math1170fb7cccdb038d7a2b41a387f%22%20font-size%3D%2216%22%20text-anchor%3D%22middle%22%20x%3D%2270.5%22%20y%3D%2224%22%3E%26%23x2212%3B%3C%2Ftext%3E%3Ctext%20font-family%3D%22horizontalbf65417dcecc7f2b0006e%22%20font-size%3D%2213%22%20text-anchor%3D%22middle%22%20x%3D%2281.5%22%20y%3D%2216%22%3E%26%23x23AF%3B%3C%2Ftext%3E%3Ctext%20font-family%3D%22horizontalbf65417dcecc7f2b0006e%22%20font-size%3D%2213%22%20text-anchor%3D%22middle%22%20x%3D%2285.5%22%20y%3D%2216%22%3E%26%23x23AF%3B%3C%2Ftext%3E%3Ctext%20font-family%3D%22Times%20New%20Roman%22%20font-size%3D%2218%22%20text-anchor%3D%22middle%22%20x%3D%2283.5%22%20y%3D%2224%22%3Ex%3C%2Ftext%3E%3Ctext%20font-family%3D%22Times%20New%20Roman%22%20font-size%3D%2213%22%20text-anchor%3D%22middle%22%20x%3D%2297.5%22%20y%3D%2218%22%3E2%3C%2Ftext%3E%3Ctext%20font-family%3D%22Times%20New%20Roman%22%20font-size%3D%2218%22%20text-anchor%3D%22middle%22%20x%3D%2247.5%22%20y%3D%2257%22%3En%3C%2Ftext%3E%3Ctext%20font-family%3D%22math1170fb7cccdb038d7a2b41a387f%22%20font-size%3D%2216%22%20text-anchor%3D%22middle%22%20x%3D%2260.5%22%20y%3D%2257%22%3E%26%23x2212%3B%3C%2Ftext%3E%3Ctext%20font-family%3D%22Times%20New%20Roman%22%20font-size%3D%2218%22%20text-anchor%3D%22middle%22%20x%3D%2273.5%22%20y%3D%2257%22%3E1%3C%2Ftext%3E%3C%2Fsvg%3E)
|
Population A (n1 = 15) </ |
|---|