Biology_A-level_Cie
-
1-1-the-microscope-in-cell-studies5 主题
-
1-2-cells-as-the-basic-units-of-living-organisms5 主题
-
2-1-testing-for-biological-molecules3 主题
-
2-2-carbohydrates-and-lipids8 主题
-
2-3-proteins6 主题
-
2-4-water2 主题
-
3-1-mode-of-action-of-enzymes5 主题
-
3-2-factors-that-affect-enzyme-action8 主题
-
4-1-fluid-mosaic-membranes4 主题
-
4-2-movement-into-and-out-of-cells12 主题
-
diffusion
-
osmosis
-
active-transport
-
endocytosis-and-exocytosis
-
investigating-transport-processes-in-plants
-
investigating-diffusion
-
surface-area-to-volume-ratios
-
investigating-surface-area
-
estimating-water-potential-in-plants
-
osmosis-in-plant-cells
-
osmosis-in-animals
-
comparing-osmosis-in-plants-and-animals
-
diffusion
-
5-1-replication-and-division-of-nuclei-and-cells6 主题
-
5-2-chromosome-behaviour-in-mitosis2 主题
-
6-1-structure-of-nucleic-acids-and-replication-of-dna4 主题
-
6-2-protein-synthesis5 主题
-
7-1-structure-of-transport-tissues4 主题
-
7-2-transport-mechanisms7 主题
-
8-1-the-circulatory-system7 主题
-
8-2-transport-of-oxygen-and-carbon-dioxide5 主题
-
8-3-the-heart4 主题
-
9-1-the-gas-exchange-system6 主题
-
10-1-infectious-diseases3 主题
-
10-2-antibiotics3 主题
-
11-1-the-immune-system4 主题
-
11-2-antibodies-and-vaccination6 主题
-
12-1-energy5 主题
-
12-2-respiration11 主题
-
aerobic-respiration-the-krebs-cycle
-
aerobic-respiration-role-of-nad-and-fad
-
aerobic-respiration-oxidative-phosphorylation
-
anaerobic-respiration
-
energy-yield-aerobic-and-anaerobic-respiration
-
anaerobic-adaptation-of-rice
-
aerobic-respiration-effect-of-temperature-and-substrate-concentration
-
structure-and-function-of-mitochondria
-
the-four-stages-in-aerobic-respiration
-
aerobic-respiration-glycolysis
-
aerobic-respiration-the-link-reaction
-
aerobic-respiration-the-krebs-cycle
-
13-1-photosynthesis-as-an-energy-transfer-process8 主题
-
13-2-investigation-of-limiting-factors2 主题
-
14-1-homeostasis-in-mammals8 主题
-
14-2-homeostasis-in-plants3 主题
-
15-1-control-and-coordination-in-mammals12 主题
-
the-endocrine-system
-
the-nervous-system
-
neurones
-
sensory-receptor-cells
-
sequence-of-events-resulting-in-an-action-potential
-
transmission-of-nerve-impulses
-
speed-of-conduction-of-impulses
-
the-refractory-period
-
cholinergic-synapses
-
stimulating-contraction-in-striated-muscle
-
ultrastructure-of-striated-muscle
-
sliding-filament-model-of-muscular-contraction
-
the-endocrine-system
-
15-2-control-and-coordination-in-plants3 主题
-
16-1-passage-of-information-from-parents-to-offspring5 主题
-
16-2-the-roles-of-genes-in-determining-the-phenotype7 主题
-
16-3-gene-control3 主题
-
17-1-variation4 主题
-
17-2-natural-and-artificial-selection7 主题
-
17-3-evolution2 主题
-
18-1-classification5 主题
-
18-2-biodiversity7 主题
-
18-3-conservation6 主题
-
19-1-principles-of-genetic-technology11 主题
-
19-2-genetic-technology-applied-to-medicine4 主题
-
19-3-genetically-modified-organisms-in-agriculture2 主题
-
1-1-the-microscope-in-cell-studies
-
1-2-cells-as-the-basic-units-of-living-organisms
-
2-1-testing-for-biological-molecules
-
2-2-carbohydrates-and-lipids
-
2-3-proteins
-
2-4-water
-
3-1-mode-of-action-of-enzymes
-
3-2-factors-that-affect-enzyme-action
-
4-1-fluid-mosaic-membranes
-
4-2-movement-into-and-out-of-cells
-
5-1-replication-and-division-of-nuclei-and-cells
-
5-2-chromosome-behaviour-in-mitosis
-
6-1-structure-of-nucleic-acids-and-replication-of-dna
-
6-2-protein-synthesis
-
7-1-structure-of-transport-tissues
-
7-2-transport-mechanisms
-
8-1-the-circulatory-system
-
8-2-transport-of-oxygen-and-carbon-dioxide
-
8-3-the-heart
-
9-1-the-gas-exchange-system
-
10-1-infectious-diseases
-
10-2-antibiotics
-
11-1-the-immune-system
-
11-2-antibodies-and-vaccination
testing-for-distribution-and-abundance
Testing for distribution & abundance
-
The distribution of a species describes how it is spread throughout the ecosystem
-
The abundance of a species is the number of individuals of that species
-
The distribution and abundance of a species in an area can be assessed using different practical methods:
-
Frame quadrats
-
Line and belt transects
-
Mark-release-recapture
-
Frame quadrats
-
Some ecosystems are very complex with large numbers of different species of different sizes
-
For the sake of logistics, sampling is often used to estimate the distribution and abundance of species
-
When carrying out sampling, square frames called quadrats can be used to mark off the area being sampled
-
Quadrats of different sizes can be used depending on what is being measured and what is most suitable in the space the samples are being made in
-
These are usually made of wood or metal and measure 25 cm × 25 cm, 50 cm × 50 cm or 1 m × 1 m
-
-
Quadrats must be laid randomly in the area to avoid sampling bias
-
This random sampling can be done by converting the sampling area into a grid format and labelling each square on the grid with a number
-
Then a random number generator is used to pick the sample points
-
-
Once the quadrat has been laid on the chosen sample point the abundance of all the different species present can be recorded
Results from quadrats
-
The results from the quadrats can be used to calculate the predicted frequency and density of a species within an area
-
Species frequency is the probability that the species will be found within any quadrat in the sample area
-
The number of quadrats that the species was present in is divided by the total number of quadrats and then multiplied by 100
-
For example, if bluebells were found in 18 out of 50 quadrats the species frequency would be (18÷50) x 100 = 36%
-
-
Species density indicates how many individuals of that species there are per unit area
-
The number of individuals counted across all quadrats is divided by the total area of all the quadrats
-
For example, if 107 bluebells were found across 50 quadrats that are 1m2 each the species density would be 107/50 = 2.14 individuals per m2
-
-
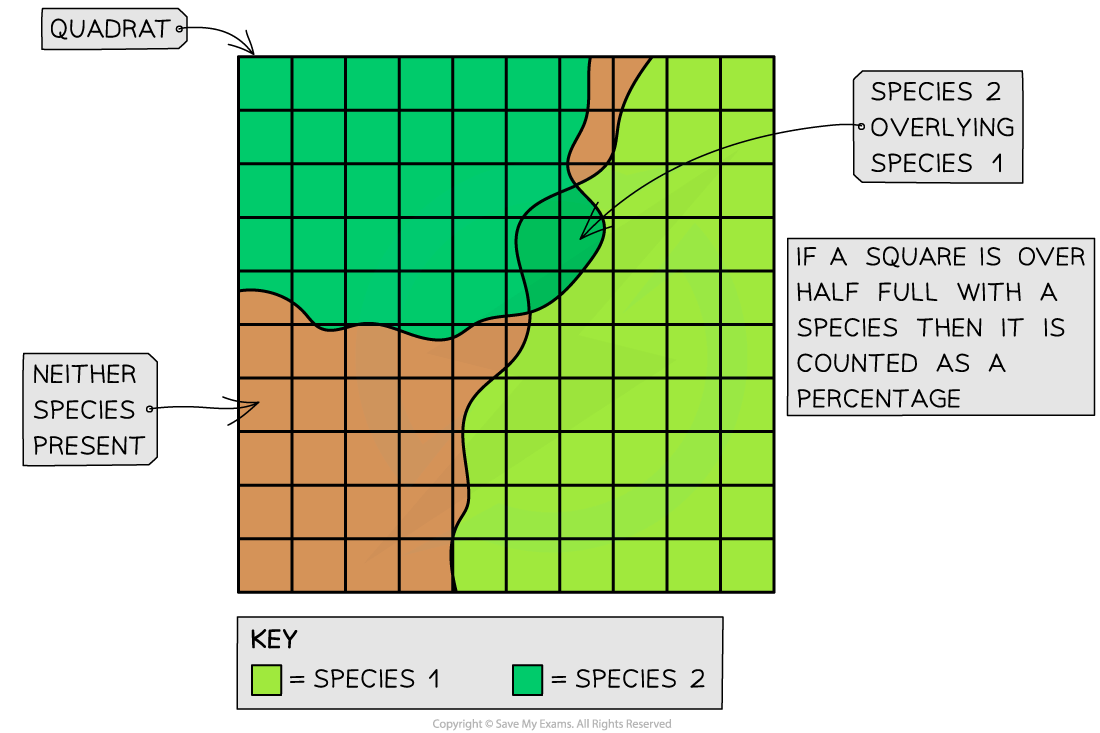
It can sometimes be difficult to count individual plants or organisms. When this is the case percentage cover of the species within the quadrat can be estimated instead
-
The quadrat is divided into 100 smaller squares
-
The number of squares the species is found in is equivalent to its percentage cover in that quadrat
-
For example, if grass is found in 89 out of 100 squares in the quadrat then it has a percentage cover of 89%
-
Line and belt transects
-
Throughout some areas, there can be changes in the physical conditions
-
For example, there may be changes in altitude, soil pH or light intensity
-
-
When investigating the species distribution in these kinds of areas, systematic sampling is more appropriate
-
Methods using transects can help show how species distribution changes with the different physical conditions in the area
-
A transect is a line represented by a measuring tape, along which sample are taken
-
-
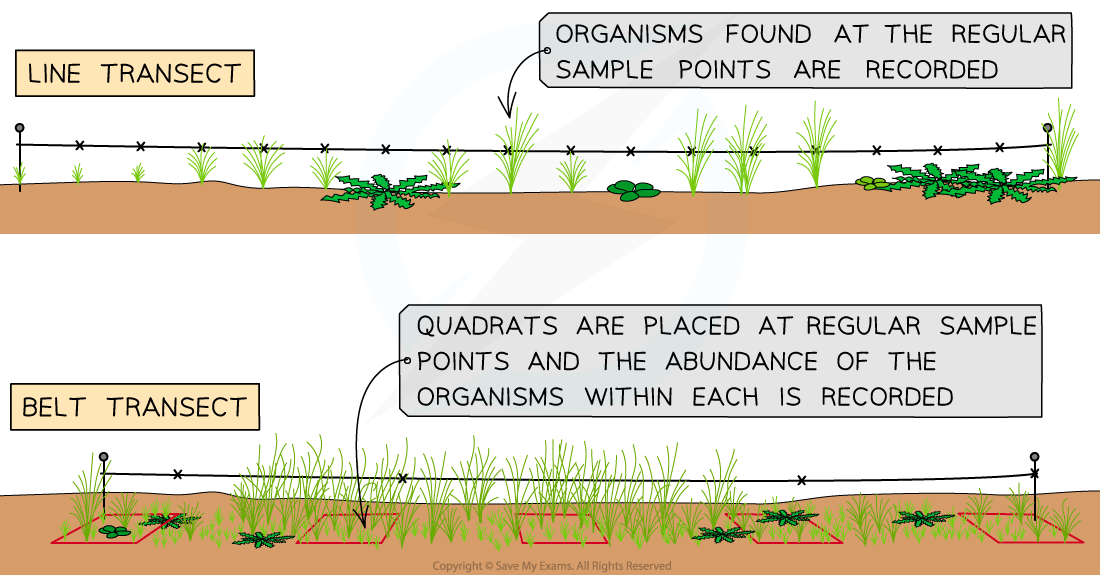
For a line transect:
-
Lay out a measuring tape in a straight line across the sample area
-
At equal distances along the tape record the identity of the organisms that touch the line. For example, every 2m
-
This produces qualitative data
-
-
For a belt transect:
-
Place quadrats at regular intervals along the tape and record the abundance of each species within each quadrat
-
This produces quantitative data
-
Mark-release-recapture
-
The methods above are only useful for stationary organisms
-
Different methods are required for estimating the number of individuals in a population of mobile animals
-
The mark-release-recapture method is used in conjunction with the Lincoln Index
-
For a single species in the area:
-
The first large sample is taken. As many individuals as possible are captured / collected, counted and marked in a way that won’t affect their survival
-
They are returned to their habitat and allowed to mix randomly with the rest of the population
-
When a sufficient amount of time has passed another large sample is captured
-
The numbers of marked and unmarked individuals within the sample are counted
-
The proportion of marked to unmarked individuals is used to calculate an estimate of the population size
-
The formula for the calculation is:
-
format('truetype')%3Bfont-weight%3Anormal%3Bfont-style%3Anormal%3B%7D%3C%2Fstyle%3E%3C%2Fdefs%3E%3Ctext%20font-family%3D%22Arial%22%20font-size%3D%2218%22%20text-anchor%3D%22middle%22%20x%3D%226.5%22%20y%3D%2235%22%3EN%3C%2Ftext%3E%3Ctext%20font-family%3D%22math102a87acd26f5771b4d57a7dfb3%22%20font-size%3D%2218%22%20text-anchor%3D%22middle%22%20x%3D%2222.5%22%20y%3D%2235%22%3E%3D%3C%2Ftext%3E%3Cline%20stroke%3D%22%23000%22%20stroke-linecap%3D%22square%22%20stroke-width%3D%221%22%20x1%3D%2234.5%22%20x2%3D%2290.5%22%20y1%3D%2228.5%22%20y2%3D%2228.5%22%2F%3E%3Ctext%20font-family%3D%22Arial%22%20font-size%3D%2218%22%20text-anchor%3D%22middle%22%20x%3D%2241.5%22%20y%3D%2218%22%3En%3C%2Ftext%3E%3Ctext%20font-family%3D%22Arial%22%20font-size%3D%2213%22%20text-anchor%3D%22middle%22%20x%3D%2249.5%22%20y%3D%2223%22%3E1%3C%2Ftext%3E%3Ctext%20font-family%3D%22math102a87acd26f5771b4d57a7dfb3%22%20font-size%3D%2218%22%20text-anchor%3D%22middle%22%20x%3D%2262.5%22%20y%3D%2218%22%3E%26%23xD7%3B%3C%2Ftext%3E%3Ctext%20font-family%3D%22Arial%22%20font-size%3D%2218%22%20text-anchor%3D%22middle%22%20x%3D%2277.5%22%20y%3D%2218%22%3En%3C%2Ftext%3E%3Ctext%20font-family%3D%22Arial%22%20font-size%3D%2213%22%20text-anchor%3D%22middle%22%20x%3D%2285.5%22%20y%3D%2223%22%3E2%3C%2Ftext%3E%3Ctext%20font-family%3D%22Arial%22%20font-size%3D%2218%22%20text-anchor%3D%22middle%22%20x%3D%2259.5%22%20y%3D%2247%22%3Em%3C%2Ftext%3E%3Ctext%20font-family%3D%22Arial%22%20font-size%3D%2213%22%20text-anchor%3D%22middle%22%20x%3D%2270.5%22%20y%3D%2252%22%3E2%3C%2Ftext%3E%3C%2Fsvg%3E)
-
Where:
-
N = population estimate
-
n1 = number of marked individuals released
-
n2 = number of individuals in the second sample (marked and unmarked)
-
m2 = number of marked individuals in the second sample
-
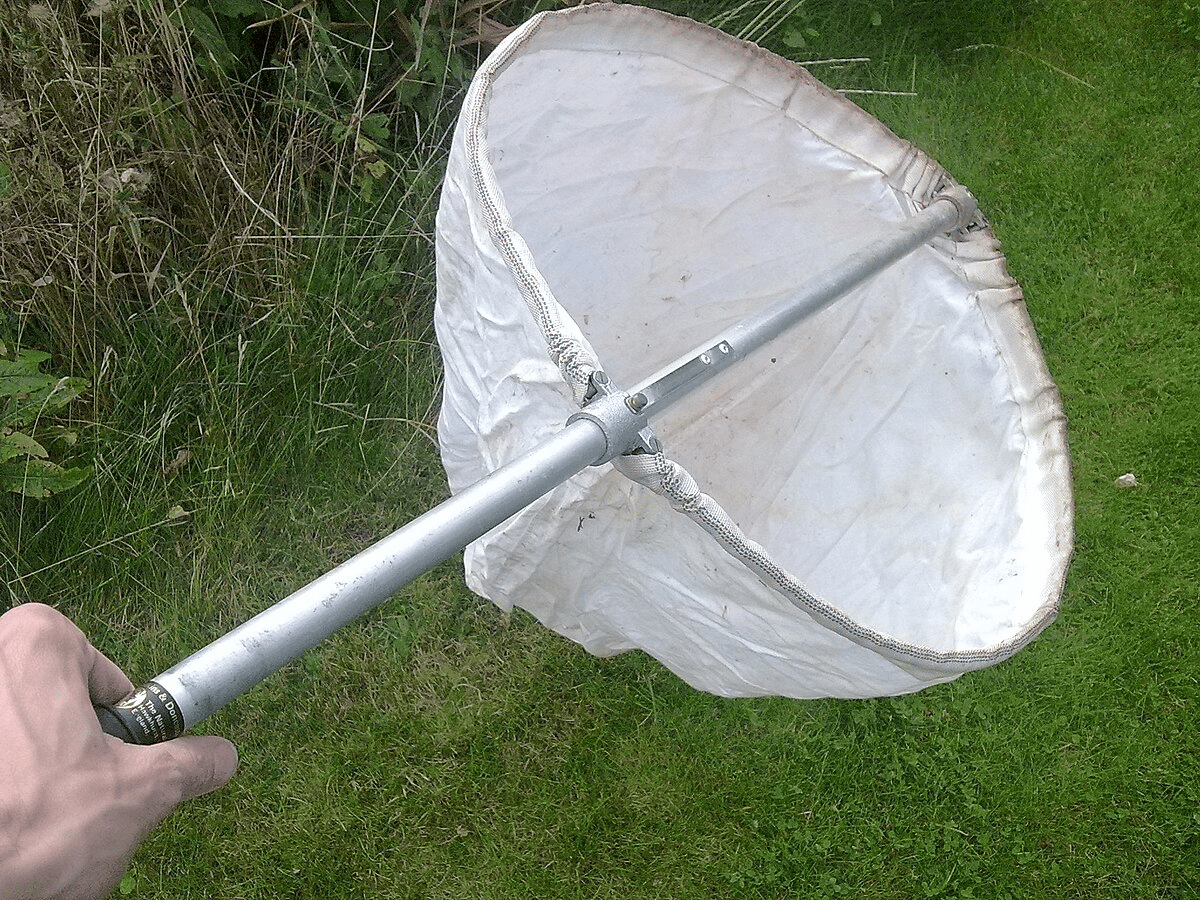
Worked Example
Lincoln Index with mark-release-recapture
Scientists wanted to investigate the abundance of leafhoppers (Cicadellidae species) in a small grassy meadow. They used sweep nets to catch a large sample of leafhoppers from the meadow.