
Biology_A-level_Cie
-
1-1-the-microscope-in-cell-studies5 主题
-
1-2-cells-as-the-basic-units-of-living-organisms5 主题
-
2-1-testing-for-biological-molecules3 主题
-
2-2-carbohydrates-and-lipids8 主题
-
2-3-proteins6 主题
-
2-4-water2 主题
-
3-1-mode-of-action-of-enzymes5 主题
-
3-2-factors-that-affect-enzyme-action8 主题
-
4-1-fluid-mosaic-membranes4 主题
-
4-2-movement-into-and-out-of-cells12 主题
-
diffusion
-
osmosis
-
active-transport
-
endocytosis-and-exocytosis
-
investigating-transport-processes-in-plants
-
investigating-diffusion
-
surface-area-to-volume-ratios
-
investigating-surface-area
-
estimating-water-potential-in-plants
-
osmosis-in-plant-cells
-
osmosis-in-animals
-
comparing-osmosis-in-plants-and-animals
-
diffusion
-
5-1-replication-and-division-of-nuclei-and-cells6 主题
-
5-2-chromosome-behaviour-in-mitosis2 主题
-
6-1-structure-of-nucleic-acids-and-replication-of-dna4 主题
-
6-2-protein-synthesis5 主题
-
7-1-structure-of-transport-tissues4 主题
-
7-2-transport-mechanisms7 主题
-
8-1-the-circulatory-system7 主题
-
8-2-transport-of-oxygen-and-carbon-dioxide5 主题
-
8-3-the-heart4 主题
-
9-1-the-gas-exchange-system6 主题
-
10-1-infectious-diseases3 主题
-
10-2-antibiotics3 主题
-
11-1-the-immune-system4 主题
-
11-2-antibodies-and-vaccination6 主题
-
12-1-energy5 主题
-
12-2-respiration11 主题
-
aerobic-respiration-the-krebs-cycle
-
aerobic-respiration-role-of-nad-and-fad
-
aerobic-respiration-oxidative-phosphorylation
-
anaerobic-respiration
-
energy-yield-aerobic-and-anaerobic-respiration
-
anaerobic-adaptation-of-rice
-
aerobic-respiration-effect-of-temperature-and-substrate-concentration
-
structure-and-function-of-mitochondria
-
the-four-stages-in-aerobic-respiration
-
aerobic-respiration-glycolysis
-
aerobic-respiration-the-link-reaction
-
aerobic-respiration-the-krebs-cycle
-
13-1-photosynthesis-as-an-energy-transfer-process8 主题
-
13-2-investigation-of-limiting-factors2 主题
-
14-1-homeostasis-in-mammals8 主题
-
14-2-homeostasis-in-plants3 主题
-
15-1-control-and-coordination-in-mammals12 主题
-
the-endocrine-system
-
the-nervous-system
-
neurones
-
sensory-receptor-cells
-
sequence-of-events-resulting-in-an-action-potential
-
transmission-of-nerve-impulses
-
speed-of-conduction-of-impulses
-
the-refractory-period
-
cholinergic-synapses
-
stimulating-contraction-in-striated-muscle
-
ultrastructure-of-striated-muscle
-
sliding-filament-model-of-muscular-contraction
-
the-endocrine-system
-
15-2-control-and-coordination-in-plants3 主题
-
16-1-passage-of-information-from-parents-to-offspring5 主题
-
16-2-the-roles-of-genes-in-determining-the-phenotype7 主题
-
16-3-gene-control3 主题
-
17-1-variation4 主题
-
17-2-natural-and-artificial-selection7 主题
-
17-3-evolution2 主题
-
18-1-classification5 主题
-
18-2-biodiversity7 主题
-
18-3-conservation6 主题
-
19-1-principles-of-genetic-technology11 主题
-
19-2-genetic-technology-applied-to-medicine4 主题
-
19-3-genetically-modified-organisms-in-agriculture2 主题
-
1-1-the-microscope-in-cell-studies
-
1-2-cells-as-the-basic-units-of-living-organisms
-
2-1-testing-for-biological-molecules
-
2-2-carbohydrates-and-lipids
-
2-3-proteins
-
2-4-water
-
3-1-mode-of-action-of-enzymes
-
3-2-factors-that-affect-enzyme-action
-
4-1-fluid-mosaic-membranes
-
4-2-movement-into-and-out-of-cells
-
5-1-replication-and-division-of-nuclei-and-cells
-
5-2-chromosome-behaviour-in-mitosis
-
6-1-structure-of-nucleic-acids-and-replication-of-dna
-
6-2-protein-synthesis
-
7-1-structure-of-transport-tissues
-
7-2-transport-mechanisms
-
8-1-the-circulatory-system
-
8-2-transport-of-oxygen-and-carbon-dioxide
-
8-3-the-heart
-
9-1-the-gas-exchange-system
-
10-1-infectious-diseases
-
10-2-antibiotics
-
11-1-the-immune-system
-
11-2-antibodies-and-vaccination
pearsons-linear-correlation
Pearson’s linear correlation
-
When recording the abundance and distribution of species in an area different trends may be observed
-
Sometimes correlation between two variables can appear in the data
-
Correlation is an association or relationship between variables
-
There is a clear distinction between correlation and causation: a correlation does not necessarily imply a causative relationship
-
Causation occurs when one variable has an influence on, or is influenced by, another
-
-
There may be a correlation between species; for example, two species always occurring together
-
There may be a correlation between a species and an abiotic factor, for example, a particular plant species and the soil pH
-
The apparent correlation between variables can be analysed using scatter graphs and different statistical tests
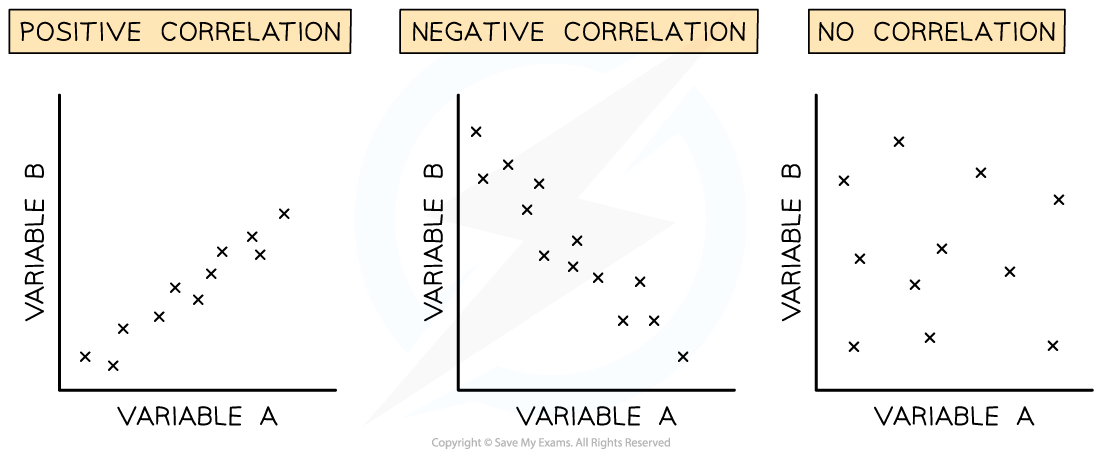
Correlation between variables
-
In order to get a broad overview of the correlation between two variables the data points for both variables can be plotted on a scatter graph
-
The correlation coefficient (r) indicates the strength of the relationship between variables
-
Perfect correlation occurs when all of the data points lie on a straight line with a correlation coefficient of 1.0 or -1.0
-
Correlation can be positive or negative
-
Positive correlation: as variable A increases, variable B increases
-
Negative correlation: as variable A increases, variable B decreases
-
-
If there is no correlation between variables the correlation coefficient will be 0
-
The correlation coefficient (r) can be calculated to determine whether a linear relationship exists between variables and how strong that relationship is
Pearson’s linear correlation
-
Pearson’s linear correlation is a statistical test that determines whether there is linear correlation between two variables
-
The data must:
-
Be quantitative, e.g. the number of individuals has been counted and a numerical value recorded
-
Show a linear relationship upon visual inspection
-
Show a normal distribution
-
-
Method:
-
Step 1: Create a scatter graph of data gathered and identify if a linear correlation exists
-
Step 2: State a null hypothesis
-
Step 3: Use the following equation to work out Pearson’s correlation coefficient r
-

Where:
-
r = correlation coefficient
-
x = number of species A
-
y = number of species B
-
n = number of readings
-
Sx = standard deviation of species A
-
Sy = standard deviation of species B
-
x̄= mean number of species A
-
ȳ= mean number of species B
-
If the correlation coefficient r is close to 1.0 or -1.0 then it can be stated that there is a strong linear correlation between the two variables and the null hypothesis can be rejected
Worked Example
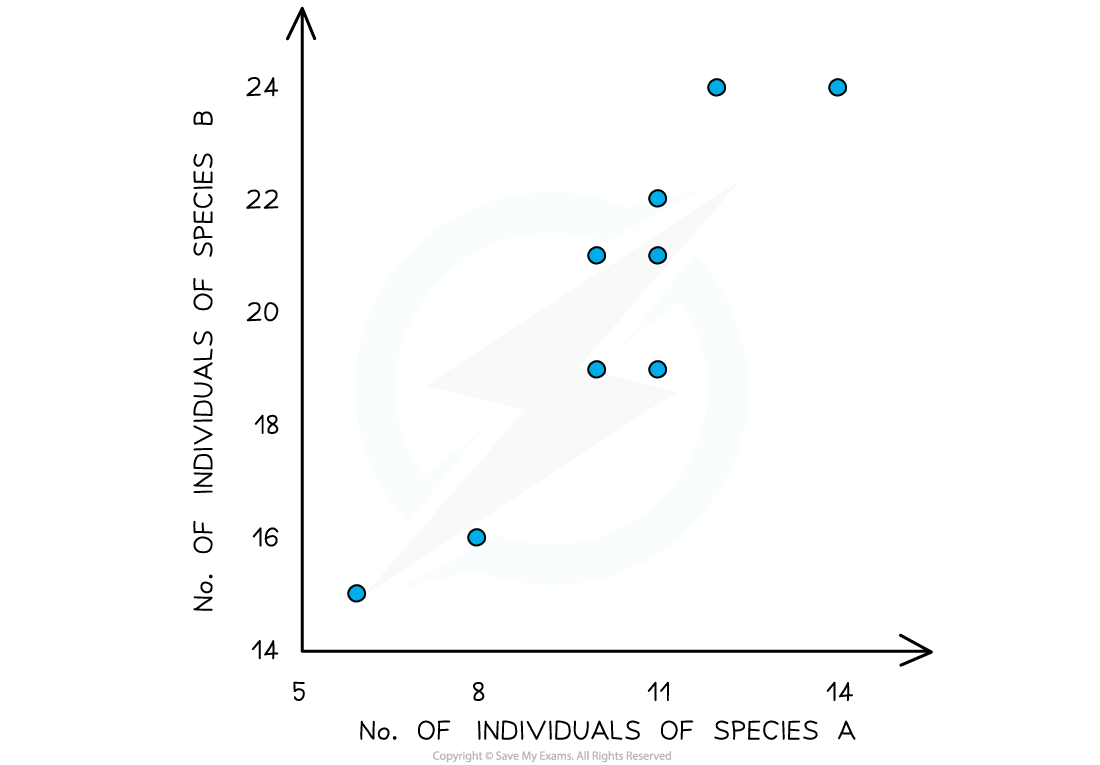
Some students used quadrats to measure the abundance of different plant species in a garden. They noticed that two particular species seemed to occur alongside each other. They plotted a scatter graph and the data they collected had no major outliers and showed roughly normal distribution.
Investigate the possible correlation using Pearson’s linear correlation coefficient.
Null hypothesis: There is no correlation between the abundance of species A and species B.
Steps to calculate the correlation coefficient:
Step 1: Calculate xy
Step 2: Calculate x̅ and y̅ (these are the means of x and y)
Step 3: Calculate nx̅y̅
Step 4: Find ∑xy
Step 5: Calculate standard deviation for each set of data Sx and Sy
Step 6: Substitute the appropriate numbers into the equation
|
Quadrat |
No. of individuals of species A (x) |
No. of individuals of species B (x) |
xy |
|---|---|---|---|
|
1 |
10 |
21 |
210 |
|
2 |
11 |
19 |
209 |
|
3 |
11 |
22 |
242 |
|
4 |
6 |
15 |
90 |
|
5 |
8 |
16 |
128 |
|
6 |
14 |
24 |
336 |
|
7 |
10 |
19 |
190 |
|
8 |
12 |
24 |
288 |
|
9 |
11 |
21 |
231 |
|
10 |
10 |
19 |
190 |
|
Mean |
x̄ = 10.3 |
ȳ = 20 |
∑xy = 2114 |
|
nx̄ȳ |
10 × 10.3 × 20 = 2060 |
|
|