
Biology_A-level_Cie
-
1-1-the-microscope-in-cell-studies5 主题
-
1-2-cells-as-the-basic-units-of-living-organisms5 主题
-
2-1-testing-for-biological-molecules3 主题
-
2-2-carbohydrates-and-lipids8 主题
-
2-3-proteins6 主题
-
2-4-water2 主题
-
3-1-mode-of-action-of-enzymes5 主题
-
3-2-factors-that-affect-enzyme-action8 主题
-
4-1-fluid-mosaic-membranes4 主题
-
4-2-movement-into-and-out-of-cells12 主题
-
diffusion
-
osmosis
-
active-transport
-
endocytosis-and-exocytosis
-
investigating-transport-processes-in-plants
-
investigating-diffusion
-
surface-area-to-volume-ratios
-
investigating-surface-area
-
estimating-water-potential-in-plants
-
osmosis-in-plant-cells
-
osmosis-in-animals
-
comparing-osmosis-in-plants-and-animals
-
diffusion
-
5-1-replication-and-division-of-nuclei-and-cells6 主题
-
5-2-chromosome-behaviour-in-mitosis2 主题
-
6-1-structure-of-nucleic-acids-and-replication-of-dna4 主题
-
6-2-protein-synthesis5 主题
-
7-1-structure-of-transport-tissues4 主题
-
7-2-transport-mechanisms7 主题
-
8-1-the-circulatory-system7 主题
-
8-2-transport-of-oxygen-and-carbon-dioxide5 主题
-
8-3-the-heart4 主题
-
9-1-the-gas-exchange-system6 主题
-
10-1-infectious-diseases3 主题
-
10-2-antibiotics3 主题
-
11-1-the-immune-system4 主题
-
11-2-antibodies-and-vaccination6 主题
-
12-1-energy5 主题
-
12-2-respiration11 主题
-
aerobic-respiration-the-krebs-cycle
-
aerobic-respiration-role-of-nad-and-fad
-
aerobic-respiration-oxidative-phosphorylation
-
anaerobic-respiration
-
energy-yield-aerobic-and-anaerobic-respiration
-
anaerobic-adaptation-of-rice
-
aerobic-respiration-effect-of-temperature-and-substrate-concentration
-
structure-and-function-of-mitochondria
-
the-four-stages-in-aerobic-respiration
-
aerobic-respiration-glycolysis
-
aerobic-respiration-the-link-reaction
-
aerobic-respiration-the-krebs-cycle
-
13-1-photosynthesis-as-an-energy-transfer-process8 主题
-
13-2-investigation-of-limiting-factors2 主题
-
14-1-homeostasis-in-mammals8 主题
-
14-2-homeostasis-in-plants3 主题
-
15-1-control-and-coordination-in-mammals12 主题
-
the-endocrine-system
-
the-nervous-system
-
neurones
-
sensory-receptor-cells
-
sequence-of-events-resulting-in-an-action-potential
-
transmission-of-nerve-impulses
-
speed-of-conduction-of-impulses
-
the-refractory-period
-
cholinergic-synapses
-
stimulating-contraction-in-striated-muscle
-
ultrastructure-of-striated-muscle
-
sliding-filament-model-of-muscular-contraction
-
the-endocrine-system
-
15-2-control-and-coordination-in-plants3 主题
-
16-1-passage-of-information-from-parents-to-offspring5 主题
-
16-2-the-roles-of-genes-in-determining-the-phenotype7 主题
-
16-3-gene-control3 主题
-
17-1-variation4 主题
-
17-2-natural-and-artificial-selection7 主题
-
17-3-evolution2 主题
-
18-1-classification5 主题
-
18-2-biodiversity7 主题
-
18-3-conservation6 主题
-
19-1-principles-of-genetic-technology11 主题
-
19-2-genetic-technology-applied-to-medicine4 主题
-
19-3-genetically-modified-organisms-in-agriculture2 主题
-
1-1-the-microscope-in-cell-studies
-
1-2-cells-as-the-basic-units-of-living-organisms
-
2-1-testing-for-biological-molecules
-
2-2-carbohydrates-and-lipids
-
2-3-proteins
-
2-4-water
-
3-1-mode-of-action-of-enzymes
-
3-2-factors-that-affect-enzyme-action
-
4-1-fluid-mosaic-membranes
-
4-2-movement-into-and-out-of-cells
-
5-1-replication-and-division-of-nuclei-and-cells
-
5-2-chromosome-behaviour-in-mitosis
-
6-1-structure-of-nucleic-acids-and-replication-of-dna
-
6-2-protein-synthesis
-
7-1-structure-of-transport-tissues
-
7-2-transport-mechanisms
-
8-1-the-circulatory-system
-
8-2-transport-of-oxygen-and-carbon-dioxide
-
8-3-the-heart
-
9-1-the-gas-exchange-system
-
10-1-infectious-diseases
-
10-2-antibiotics
-
11-1-the-immune-system
-
11-2-antibodies-and-vaccination
investigating-rqs
Investigating RQs
-
Respirometers are used to measure and investigate the rate of oxygen consumption during respiration in organisms
-
They can also be used to calculate respiratory quotients
-
The experiments usually involve organisms such as germinating seeds or invertebrates
The equation for calculating a change in gas volume
-
The volume of oxygen consumed (cm3 min-1) can be worked out using:
-
The diameter of the capillary tube r (cm)
-
And the distance moved by the manometer fluid h (cm) in a minute
-
-
Using the formula:
πr2h
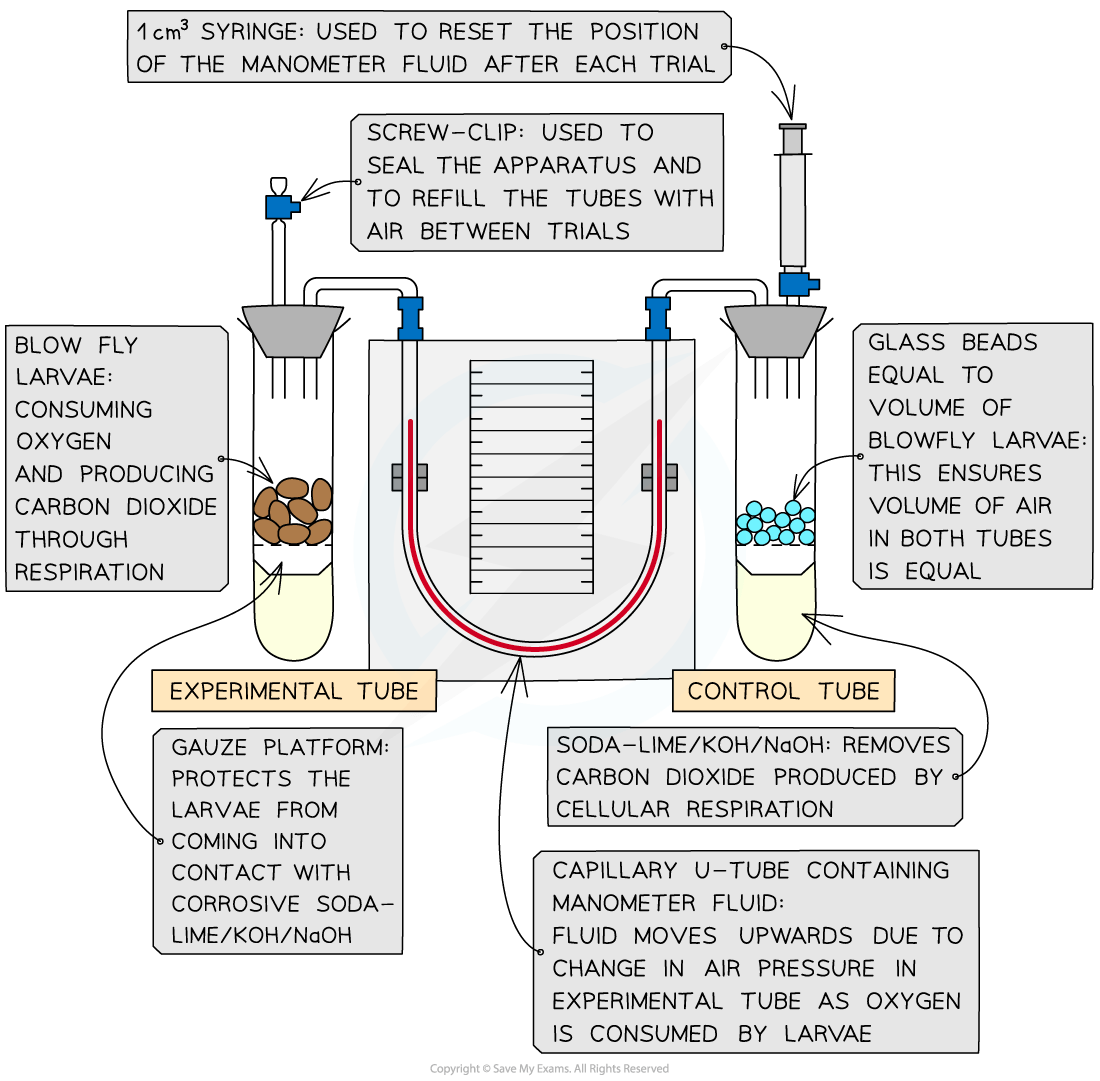
Using a respirometer to determine the respiratory quotient
Method
-
Measure oxygen consumption: set up the respirometer and run the experiment with soda-lime present in both tubes. Use the manometer reading to calculate the change in gas volume within a given time, x cm3 min-1
-
Always read from the side of the U-tube manometer closest to the respiring organisms (the left side as depicted in this diagram)
-
-
Reset the apparatus: allow air to re-enter the tubes via the screw cap and reset the manometer fluid using the syringe
-
Run the experiment again: remove the soda-lime from both tubes and use the manometer reading to calculate the change in gas volume in a given time, y cm3 min-1
Calculations
-
x tells us the volume of oxygen consumed by respiration within a given time
-
y tells us the volume of oxygen consumed by respiration within a given time minus the volume of carbon dioxide produced within a given time
-
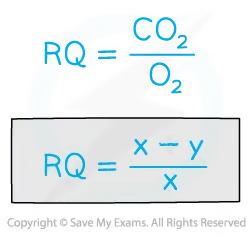
(x – y) is therefore the volume of CO2 given off by the organisms
-
remembering to read the scale on the side of the U-tube manometer closest to the respiring organisms
-
-
The two measurements x and y can be used to calculate the RQ
Worked Example
Calculating RQ from a respirometer experiment
x = 2.9 cm3 min-1
y = 0.8 cm3 min-1
![]()
![]()
When equal volumes of oxygen are consumed and carbon dioxide produced (as seen with glucose) the manometer fluid will not move and y will be 0, making the RQ=1.
Analysis
-
Respirometers can be used in experiments to investigate how different factors affect the RQ of organisms over time
-
e.g. temperature – using a series of water baths
-
-
When an RQ value changes it means the substrate being respired has changed
-
Some cells may also be using a mixture of substrates in respiration e.g. An RQ value of 0.85 suggests both carbohydrates and lipids are being used at the same time
-
This is because the RQ of glucose is 1 and the RQ of lipids is 0.7
-
-
Under normal cellular conditions, the order which substrates are used in respiration is: carbohydrates, lipids and proteins
-
The RQ can also give an indication of under or overfeeding:
-
An RQ value of more than 1 suggests excessive carbohydrate/calorie intake
-
An RQ value of less than 0.7 suggests underfeeding
-
Examiner Tips and Tricks
There are several ways you can manage variables and increase the reliability of results in respirometer experiments:
-
Use a controlled water bath to keep the temperature constant
-
Have a control tube with an equal volume of inert material to the volume of the organisms to compensate for changes in atmospheric pressure
-
Repeat the experiment multiple times and calculate a mean