
Biology_A-level_Aqa
-
1-biological-molecules
1-1-biological-molecules-carbohydrates11 主题-
1-1-1-biological-molecules-key-terms
-
1-1-2-biological-molecules-reactions
-
1-1-3-monosaccharides
-
1-1-4-glucose
-
1-1-5-the-glycosidic-bond
-
1-1-6-chromatography-monosaccharides
-
1-1-7-disaccharides
-
1-1-8-starch-and-glycogen
-
1-1-9-cellulose
-
1-1-10-biochemical-tests-sugars-and-starch
-
1-1-11-finding-the-concentration-of-glucose
-
1-1-1-biological-molecules-key-terms
-
1-2-biological-molecules-lipids3 主题
-
1-3-biological-molecules-proteins5 主题
-
1-4-proteins-enzymes12 主题
-
1-4-1-many-proteins-are-enzymes
-
1-4-2-enzyme-specificity
-
1-4-3-how-enzymes-work
-
1-4-4-required-practical-measuring-enzyme-activity
-
1-4-5-drawing-a-graph-for-enzyme-rate-experiments
-
1-4-6-using-a-tangent-to-find-initial-rate-of-reaction
-
1-4-7-limiting-factors-affecting-enzymes-temperature
-
1-4-8-limiting-factors-affecting-enzymes-ph
-
1-4-10-limiting-factors-affecting-enzymes-enzyme-concentration
-
1-4-11-limiting-factors-affecting-enzymes-substrate-concentration
-
1-4-12-limiting-factors-affecting-enzymes-inhibitors
-
1-4-14-control-of-variables-and-uncertainty
-
1-4-1-many-proteins-are-enzymes
-
1-5-nucleic-acids-structure-and-dna-replication8 主题
-
1-5-2-nucleotide-structure-and-the-phosphodiester-bond
-
1-5-3-dna-structure-and-function
-
1-5-4-rna-structure-and-function
-
1-5-5-ribosomes
-
1-5-6-the-origins-of-research-on-the-genetic-code
-
1-5-8-the-process-of-semi-conservative-replication
-
1-5-9-calculating-the-frequency-of-nucleotide-bases
-
1-5-10-the-watson-crick-model
-
1-5-2-nucleotide-structure-and-the-phosphodiester-bond
-
1-6-atp-water-and-inorganic-ions4 主题
-
2-cell-structure2-1-cell-structure7 主题
-
2-2-the-microscope-in-cell-studies4 主题
-
2-3-cell-division-in-eukaryotic-and-prokaryotic-cells8 主题
-
2-4-cell-membranes-and-transport7 主题
-
2-5-cell-recognition-and-the-immune-system7 主题
-
2-6-vaccines-disease-and-monoclonal-antibodies6 主题
-
3-exchange-and-transport3-1-adaptations-for-gas-exchange6 主题
-
3-2-human-gas-exchange10 主题
-
3-2-1-the-human-gas-exchange-system
-
3-2-2-dissecting-the-gas-exchange-system
-
3-2-3-microscopy-and-gas-exchange-surfaces
-
3-2-4-investigating-gas-exchange
-
3-2-5-the-alveolar-epithelium
-
3-2-6-ventilation-and-gas-exchange
-
3-2-8-the-effects-of-lung-disease
-
3-2-9-pollution-and-smoking-data
-
3-2-10-risk-factor-data
-
3-2-11-correlations-and-causal-relationships
-
3-2-1-the-human-gas-exchange-system
-
3-3-digestion-and-absorption5 主题
-
3-4-mass-transport-in-animals6 主题
-
3-5-the-circulatory-system-in-animals8 主题
-
3-6-mass-transport-in-plants6 主题
-
4-genetics-variation-and-interdependence4-1-dna-genes-and-chromosomes7 主题
-
4-2-dna-and-protein-synthesis6 主题
-
4-3-genetic-diversity-mutations-and-meiosis7 主题
-
4-4-genetic-diversity-and-adaptation6 主题
-
4-5-species-and-taxonomy4 主题
-
4-6-biodiversity9 主题
-
5-energy-transfers-in-and-between-organisms-a-level-only5-1-photosynthesis-a-level-only5 主题
-
5-2-respiration-a-level-only7 主题
-
5-3-energy-and-ecosystems-a-level-only9 主题
-
5-4-nutrient-cycles-a-level-only4 主题
-
6-organisms-respond-to-changes-in-their-environments-a-level-only6-1-response-to-stimuli-a-level-only12 主题
-
6-1-1-survival-and-response
-
6-1-2-growth-factors-in-flowering-plants
-
6-1-3-indoleacetic-acid-iaa
-
6-1-4-taxes-and-kinesis
-
6-1-5-reflex-arcs
-
6-1-6-required-practical-investigating-animal-movement
-
6-1-7-the-pacinian-corpuscle
-
6-1-8-pacinian-corpuscles-generator-potential
-
6-1-9-investigating-touch-and-temperature-receptors
-
6-1-10-the-human-retina
-
6-1-11-myogenic-stimulation-of-the-heart
-
6-1-13-heart-rate
-
6-1-1-survival-and-response
-
6-2-nervous-coordination-a-level-only10 主题
-
6-3-skeletal-muscles-a-level-only6 主题
-
6-4-homeostasis-a-level-only11 主题
-
6-4-1-principles-of-homeostasis
-
6-4-2-negative-feedback
-
6-4-3-glucose-concentration-and-insulin
-
6-4-4-glucose-regulation-glucagon
-
6-4-5-glucose-regulation-adrenaline
-
6-4-6-glucose-regulation-the-liver
-
6-4-7-diabetes
-
6-4-8-required-practical-determining-the-concentration-of-glucose-in-urine
-
6-4-9-nephron-structure
-
6-4-10-nephron-function
-
6-4-11-control-of-blood-water-potential
-
6-4-1-principles-of-homeostasis
-
7-genetics-populations-evolution-and-ecosystems-a-level-only7-1-inheritance-a-level-only6 主题
-
7-2-populations-a-level-only3 主题
-
7-3-evolution-a-level-only5 主题
-
7-4-populations-in-ecosystems-a-level-only7 主题
-
8-the-control-of-gene-expression-a-level-only8-1-genetic-mutations-a-level-only2 主题
-
8-2-regulation-of-gene-expression-a-level-only11 主题
-
8-2-1-totipotent-cells
-
8-2-2-stem-cells
-
8-2-3-the-use-of-stem-cells
-
8-2-4-producing-tissue-cultures-of-explants
-
8-2-5-regulation-of-transcription
-
8-2-6-evaluating-data-about-genetic-expression
-
8-2-7-epigenetics
-
8-2-8-epigenetics-and-disease
-
8-2-9-rna-interference
-
8-2-10-two-types-of-tumours
-
8-2-11-tumour-development
-
8-2-1-totipotent-cells
-
8-3-using-genome-projects-a-level-only4 主题
-
8-4-gene-technologies-a-level-only13 主题
-
8-4-1-recombinant-dna-technology
-
8-4-2-producing-fragments-of-dna
-
8-4-3-investigating-the-specificity-of-restriction-enzymes
-
8-4-4-polymerase-chain-reaction
-
8-4-5-culture-of-transformed-host-cells
-
8-4-6-uses-of-recombinant-dna-technology
-
8-4-7-dna-probes-and-dna-hybridisation
-
8-4-8-screening-patients
-
8-4-9-genetic-counselling-and-personalised-medicine
-
8-4-10-variable-number-tandem-repeats
-
8-4-11-gel-electrophoresis
-
8-4-12-genetic-fingerprinting
-
8-4-13-uses-of-genetic-fingerprinting
-
8-4-1-recombinant-dna-technology
-
exam-guidance-and-skillsessay-guidance3 主题
7-4-3-carrying-capacity
Carrying capacity
-
The maximum stable population size of a species that an ecosystem can support is known as the carrying capacity
-
Although all individuals can potentially reproduce, abiotic and biotic factors limit survival and reproduction
-
This ensures the population size of each species is limited at some point (i.e. the carrying capacity of that species is reached)
-
Most species remain below or at carrying capacity due to these limiting factors
-
Humans are a possible exception, as we’ve overcome many natural limitations
-
-
The graph below shows the population growth of a population of lions
-
The point at which the graph started to flatten out (plateau) is the carrying capacity of this population
-
At this point, the environmental (abiotic and biotic) factors that stop all individuals from surviving and reproducing result in the population no longer being able to grow in size
-

Factors affecting population size
Abiotic factors
-
Abiotic factors involve the non-living parts of an ecosystem
-
Some examples of abiotic factors that can limit population size include:
-
light availability
-
water supply
-
temperature
-
amount of space available
-
soil pH
-
-
If environmental temperature is far from a mammal’s optimum, individuals use more energy to maintain their optimum body temperature (via homeostasis), leaving less energy for growth and reproduction
-
Fewer reach reproductive age, so population growth is limited
-
Biotic factors
-
Biotic factors involve the living parts of an ecosystem
-
Biotic factors are the interactions between organisms
-
This includes things like competition for resources and predation
-
-
Biotic factors can be split into three main types:
-
Interspecific competition
-
Intraspecific competition
-
Predation
-
Interspecific competition
-
Occurs when different species compete for the same resources (e.g. food, space, nesting sites)
-
Can limit both populations if species are similarly adapted, as resources are shared
-
If one species is better adapted, it may outcompete the other:
-
The weaker competitor declines in number or is excluded
-
-
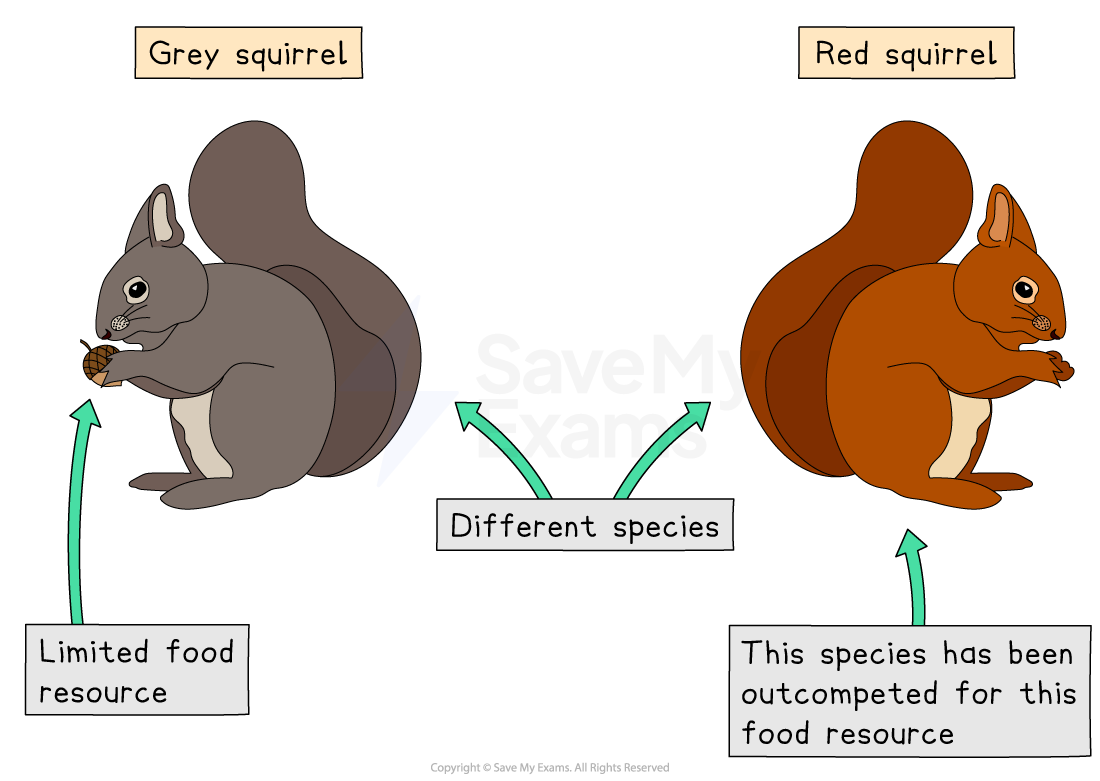
For example, in the UK, grey squirrels outcompete red squirrels because:
-
Grey squirrels eat a wider range of food
-
They are also larger and have better fat storage in winter
-
This leads to greater survival and reproduction
-
-
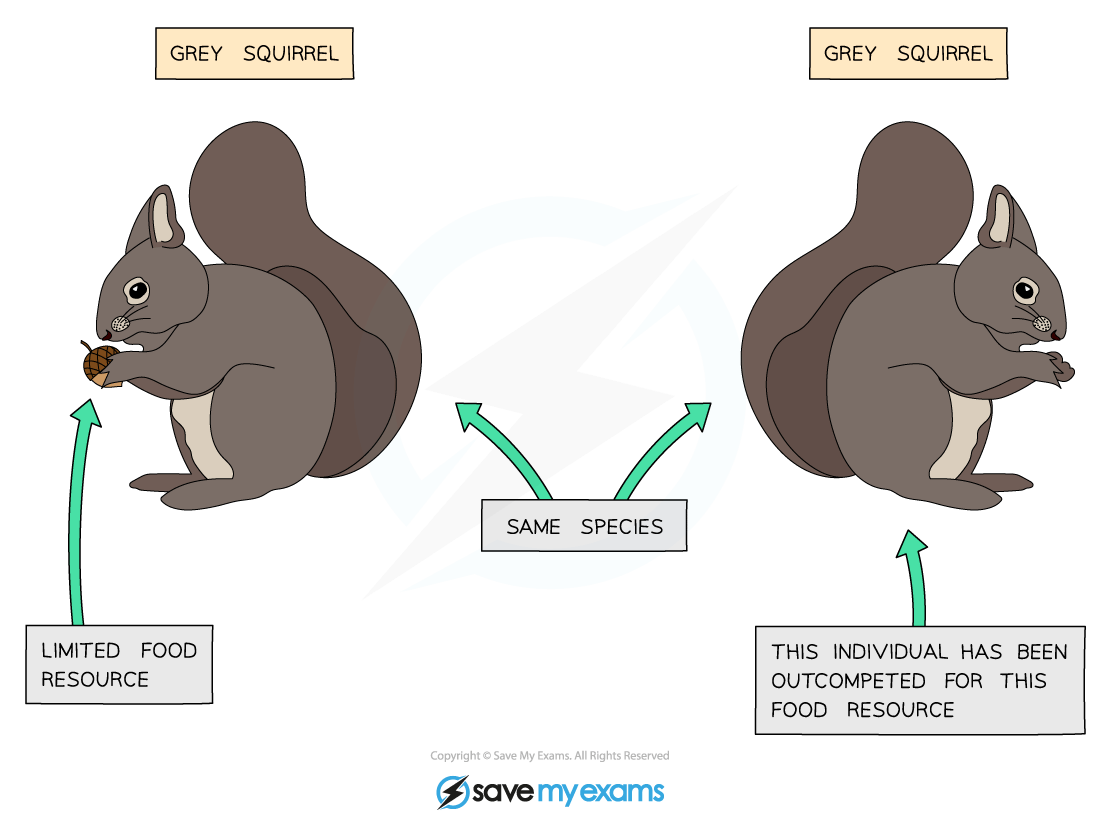
Intraspecific competition
-
This is competition for the same resources between individuals from the same species
-
For example: grey squirrels compete with grey squirrels
-
When resources are plentiful, grey squirrel numbers increase
-
More individuals compete for food and shelter
-
Resources become limiting, so the population stabilises at the carrying capacity
-
Predation
-
Producers are eaten by primary consumers, which in turn may be eaten by secondary consumers who are themselves eaten by tertiary consumers
-
Predators are consumers that kill and eat prey
-
In a stable community, predator and prey populations cycle as follows:
-
Prey numbers rise → meaning there is more food for predators
-
Predator numbers rise → so more prey is eaten
-
Prey numbers fall → therefore there is less food for predators
-
Predator numbers fall → meaning less pressure on prey
-
Prey numbers rise again → cycle repeats
-
