
Biology AS OCR
-
1-1-practical-skills-written-assessment AS7 主题
-
1-2-practical-skills-endorsement-assessment AS16 主题
-
1-2-1-practical-ethical-use-of-organisms as
-
1-2-2-practical-aseptic-techniques as
-
1-2-3-practical-dissection-of-gas-exchange-surfaces-in-fish-and-insects as
-
1-2-4-drawing-cells-from-blood-smears as
-
1-2-5-practical-investigating-biodiversity-using-sampling as
-
1-2-6-practical-data-loggers-and-computer-modelling as
-
1-2-7-practical-investigating-the-rate-of-diffusion as
-
1-2-8-practical-investigating-water-potential as
-
1-2-9-practical-factors-affecting-membrane-structure-and-permeability as
-
1-2-10-biochemical-tests-reducing-sugars-and-starch as
-
1-2-11-biochemical-tests-lipids as
-
1-2-12-biochemical-tests-proteins as
-
1-2-13-chromatography as
-
1-2-14-serial-dilutions as
-
1-2-15-practical-investigating-the-rate-of-transpiration as
-
1-2-16-practical-using-a-light-microscope as
-
1-2-1-practical-ethical-use-of-organisms as
-
2-1-cell-structure AS9 主题
-
2-1-2-using-a-microscope as
-
2-1-3-drawing-cells as
-
2-1-4-magnification-and-resolution as
-
2-1-5-eukaryotic-cells as
-
2-1-6-eukaryotic-cells-under-the-microscope as
-
2-1-7-organelles-and-the-production-of-proteins as
-
2-1-8-the-cytoskeleton as
-
2-1-9-prokaryotic-and-eukaryotic-cells as
-
2-1-1-studying-cells as
-
2-1-2-using-a-microscope as
-
2-2-biological-molecules AS17 主题
-
2-2-1-properties-of-water as
-
2-2-2-monomers-and-polymers as
-
2-2-3-monosaccharides as
-
2-2-4-the-glycosidic-bond as
-
2-2-5-polysaccharides as
-
2-2-6-biochemical-tests-reducing-sugars-and-starch as
-
2-2-7-lipids-and-ester-bonds as
-
2-2-8-lipids-structure-and-function as
-
2-2-9-biochemical-tests-lipids as
-
2-2-10-amino-acids-and-peptide-bonds as
-
2-2-11-protein-structure as
-
2-2-12-globular-proteins as
-
2-2-13-fibrous-proteins as
-
2-2-14-inorganic-ions as
-
2-2-15-biochemical-tests-proteins as
-
2-2-16-finding-the-concentration-of-a-substance as
-
2-2-17-chromatography as
-
2-2-1-properties-of-water as
-
2-3-nucleotides-and-nucleic-acids AS8 主题
-
2-4-enzymes AS9 主题
-
2-4-1-the-role-of-enzymes as
-
2-4-2-enzyme-action as
-
2-4-3-enzyme-activity-ph as
-
2-4-4-enzyme-activity-temperature as
-
2-4-5-enzyme-activity-enzyme-concentration as
-
2-4-6-enzyme-activity-substrate-concentration as
-
2-4-7-enzyme-activity-enzyme-inhibitors as
-
2-4-8-coenzymes-cofactors-and-prosthetic-groups as
-
2-4-9-practical-measuring-enzyme-activity as
-
2-4-1-the-role-of-enzymes as
-
2-5-biological-membranes AS9 主题
-
2-5-1-the-cell-surface-membrane as
-
2-5-2-membrane-structure-and-permeability as
-
2-5-3-diffusion-and-facilitated-diffusion as
-
2-5-4-practical-investigating-the-rate-of-diffusion as
-
2-5-5-active-transport as
-
2-5-6-endocytosis-and-exocytosis as
-
2-5-7-osmosis as
-
2-5-8-osmosis-in-animal-and-plant-cells as
-
2-5-9-practical-investigating-water-potential as
-
2-5-1-the-cell-surface-membrane as
-
2-6-cell-division-cell-diversity-and-cellular-organisation AS11 主题
-
2-6-1-the-cell-cycle as
-
2-6-2-the-stages-of-mitosis as
-
2-6-3-identifying-mitosis-in-plant-cells as
-
2-6-4-the-significance-of-mitosis as
-
2-6-5-the-stages-of-meiosis as
-
2-6-6-the-significance-of-meiosis as
-
2-6-7-specialised-cells as
-
2-6-8-the-organisation-of-cells as
-
2-6-9-stem-cells as
-
2-6-10-stem-cells-in-animals-and-plants as
-
2-6-11-the-use-of-stem-cells as
-
2-6-1-the-cell-cycle as
-
3-1-exchange-surfaces AS7 主题
-
3-2-transport-in-animals AS12 主题
-
3-2-1-the-need-for-transport-systems-in-animals as
-
3-2-2-circulatory-systems as
-
3-2-3-blood-vessels as
-
3-2-4-tissue-fluid as
-
3-2-5-the-mammalian-heart as
-
3-2-6-practical-mammalian-heart-dissection as
-
3-2-7-the-cardiac-cycle as
-
3-2-8-cardiac-output as
-
3-2-9-heart-action-initiation-and-control as
-
3-2-10-electrocardiograms-ecgs as
-
3-2-11-the-role-of-haemoglobin as
-
3-2-12-adult-and-fetal-haemoglobin as
-
3-2-1-the-need-for-transport-systems-in-animals as
-
3-3-transport-in-plants AS11 主题
-
3-3-1-the-need-for-transport-systems-in-plants as
-
3-3-2-the-xylem-and-phloem as
-
3-3-3-the-xylem as
-
3-3-4-the-phloem as
-
3-3-5-transverse-sections-stems-roots-and-leaves as
-
3-3-6-the-process-of-transpiration as
-
3-3-7-transpiration-in-plants as
-
3-3-8-practical-investigating-the-rate-of-transpiration as
-
3-3-9-translocation as
-
3-3-10-the-mass-flow-hypothesis as
-
3-3-11-the-adaptations-of-xerophytic-and-hydrophytic-plants as
-
3-3-1-the-need-for-transport-systems-in-plants as
-
4-1-communicable-diseases-disease-prevention-and-the-immune-system AS16 主题
-
4-1-1-common-pathogens-and-communicable-diseases as
-
4-1-2-transmission-of-communicable-pathogens as
-
4-1-3-plant-defences-against-pathogens as
-
4-1-4-non-specific-immune-responses as
-
4-1-5-phagocytes as
-
4-1-6-blood-cells as
-
4-1-7-the-t-lymphocyte-response as
-
4-1-8-the-b-lymphocyte-response as
-
4-1-9-primary-and-secondary-immune-responses as
-
4-1-10-antibodies as
-
4-1-11-opsonins-agglutinins-and-anti-toxins as
-
4-1-12-types-of-immunity as
-
4-1-13-autoimmune-diseases as
-
4-1-14-principles-of-vaccination as
-
4-1-15-sources-of-medicine as
-
4-1-16-antibiotics as
-
4-1-1-common-pathogens-and-communicable-diseases as
-
4-2-biodiversity AS10 主题
-
4-2-1-biodiversity as
-
4-2-2-sampling-to-determine-biodiversity as
-
4-2-3-practical-investigating-biodiversity-using-sampling as
-
4-2-4-measuring-species-richness-and-species-evenness as
-
4-2-5-simpsons-index as
-
4-2-6-genetic-diversity as
-
4-2-7-factors-affecting-biodiversity as
-
4-2-8-reasons-for-maintaining-biodiversity as
-
4-2-9-methods-of-maintaining-biodiversity as
-
4-2-10-conservation-agreements as
-
4-2-1-biodiversity as
-
4-3-classification-and-evolution AS15 主题
-
4-3-1-classification-of-species as
-
4-3-2-binomial-system as
-
4-3-3-classification-of-the-three-domains as
-
4-3-4-classification-of-the-five-kingdoms as
-
4-3-5-classification-and-phylogeny as
-
4-3-6-evidence-of-evolution as
-
4-3-7-types-of-variation as
-
4-3-8-standard-deviation as
-
4-3-9-variation-t-test-method as
-
4-3-10-variation-t-test-worked-example as
-
4-3-11-spearmans-rank-correlation as
-
4-3-12-adaptation as
-
4-3-13-natural-selection as
-
4-3-14-evolution-of-resistance as
-
4-3-15-consequences-of-resistance as
-
4-3-1-classification-of-species as
1-1-6-mathematical-analysis-of-results as
Exam code:H020
Mathematical Analysis of Results
-
Quantitative investigations of variation can involve the interpretation of mean values and their standard deviations
-
A mean value describes the average value of a data set
-
Standard deviation is a measure of the spread or dispersion of data around the mean
-
A small standard deviation indicates that the results lie close to the mean (less variation)
-
Large standard deviation indicates that the results are more spread out

Two graphs showing the distribution of values when the mean is the same but one has a large standard deviation and the other a small standard deviation
Comparison between groups
-
When comparing the results from different groups or samples, using a measure of central tendency, such as the mean, can be quite misleading
-
For example, looking at the two groups below
-
Group A: 2, 15, 14, 15, 16, 15, 14
-
Group B: 1, 3, 10, 15, 20, 22, 20
-
-
Both groups have the same mean of 13
-
However, most of the values in group A lie close to the mean, whereas in group B most values lie quite far from the mean
-
For comparison between groups or samples it is better practice to use standard deviation in conjunction with the mean
-
Whether or not the standard deviations of different data sets overlap can provide a lot of information:
-
If there is an overlap between the standard deviations then it can be said that two sets of results are not significantly different
-
If there is no overlap between the standard deviations then it can be said that two sets of results are significantly different
-
Worked Example
A group of scientists wanted to investigate the effects of a specific diet on the risk of coronary heart disease. One group was given a specific diet for 8 weeks, while the other group acted as a control. After the 8 weeks scientists measured the diameter of the lumen of the main artery in the arm of the volunteers. The results of the experiment are shown in Table 1 below:
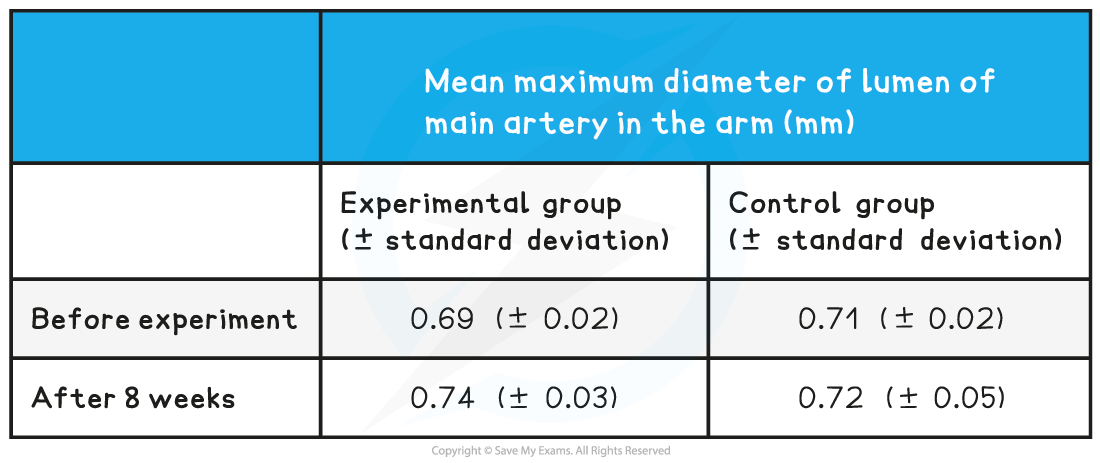
Use the standard deviations above to evaluate whether the diet had a significant effect?
[2 marks]
Answer:
Step one: find the full range of values included within the standard deviations for each data set
Experimental group before: 0.67 to 0.71mm
Experimental group after: 0.71 to 0.77mm
Control group before: 0.69 to 0.73mm
Control group after: 0.67 to 0.77mm
Step two: use this information to form your answer
There is an overlap of standard deviations in the experimental group before and after the experiment (0.67~0.71mm and 0.71~0.77mm) so it can be said that the difference before and after the experiment is not significant; [1 mark]
There is also an overlap of standard deviations between the experimental and control groups after the eight weeks (0.71~0.77mm and 0.67~0.77mm) so it can be said that the difference between groups is not significant; [1 mark]
Examiner Tips and Tricks
The standard deviations of a data set are not always presented in a table, they can also be represented by standard deviation error bars on a graph.
Plotting & Interpreting Graphs
-
Plotting data from investigations in the appropriate format allows you to more clearly see the relationship between two variables
-
This makes the results of experiments much easier to interpret
-
First, you need to consider what type of data you have:
-
Qualitative data (non-numerical data e.g. blood group)
-
Discrete data (numerical data that can only take certain values in a range e.g. shoe size)
-
Continuous data (numerical data that can take any value in a range e.g. height or weight)
-
-
For qualitative and discrete data, bar charts or pie charts are most suitable
-
For continuous data, line graphs or scatter graphs are most suitable
-
Scatter graphs are especially useful for showing how two variables are correlated (related to one another)
-
Tips for plotting data
-
Whatever type of graph you use, remember the following:
-
The data should be plotted with the independent variable on the x-axis and the dependent variable on the y-axis
-
Plot data points accurately
-
Use appropriate linear scales on axes
-
Choose scales that enable all data points to be plotted within the graph area
-
Label axes, with units included
-
Make graphs that fill the space the exam paper gives you
-
Draw a line of best fit. This may be straight or curved depending on the trend shown by the data. If the line of best fit is a curve make sure it is drawn smoothly. A line of best-fit should have a balance of data points above and below the line
-
In some cases, the line or curve of best fit should be drawn through the origin (but only if the data and trend allow it)
-
Using a tangent to find the initial rate of a reaction
-
For linear graphs (i.e. graphs with a straight-line), the gradient is the same throughout
-
This makes it easy to calculate the rate of change (rate of change = change ÷ time)
-
-
However, many enzyme rate experiments produce non-linear graphs (i.e. graphs with a curved line), meaning they have an ever-changing gradient
-
They are shaped this way because the reaction rate is changing over time
-
-
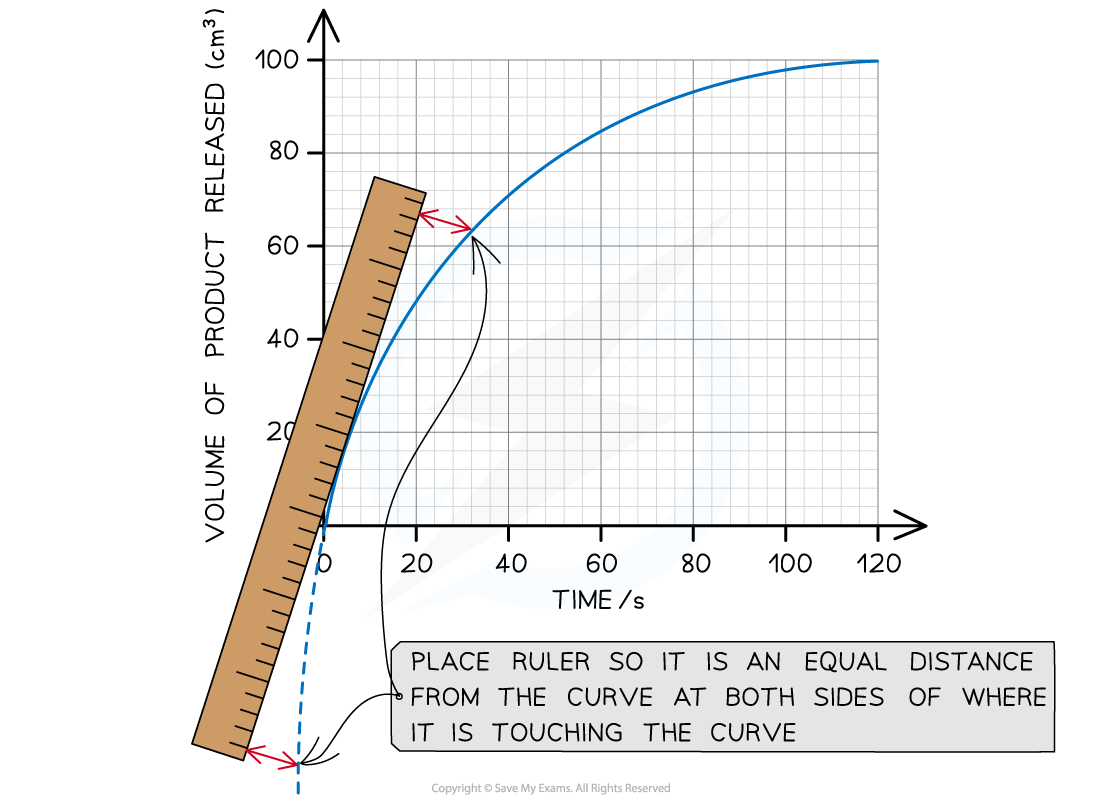
In these cases, a tangent can be used to find the reaction rate at any one point on the graph:
-
A tangent is a straight line that is drawn so it just touches the curve at a single point
-
The slope of this tangent matches the slope of the curve at just that point
-
You then simply find the gradient of the straight line (tangent) you have drawn
-
-
The initial rate of reaction is the rate of reaction at the start of the reaction (i.e. where time = 0)
Worked Example
The graph below shows the results of an enzyme rate reaction. Using this graph, calculate the initial rate of reaction.

Answer:
Step 1: Estimate the extrapolated curve of the graph
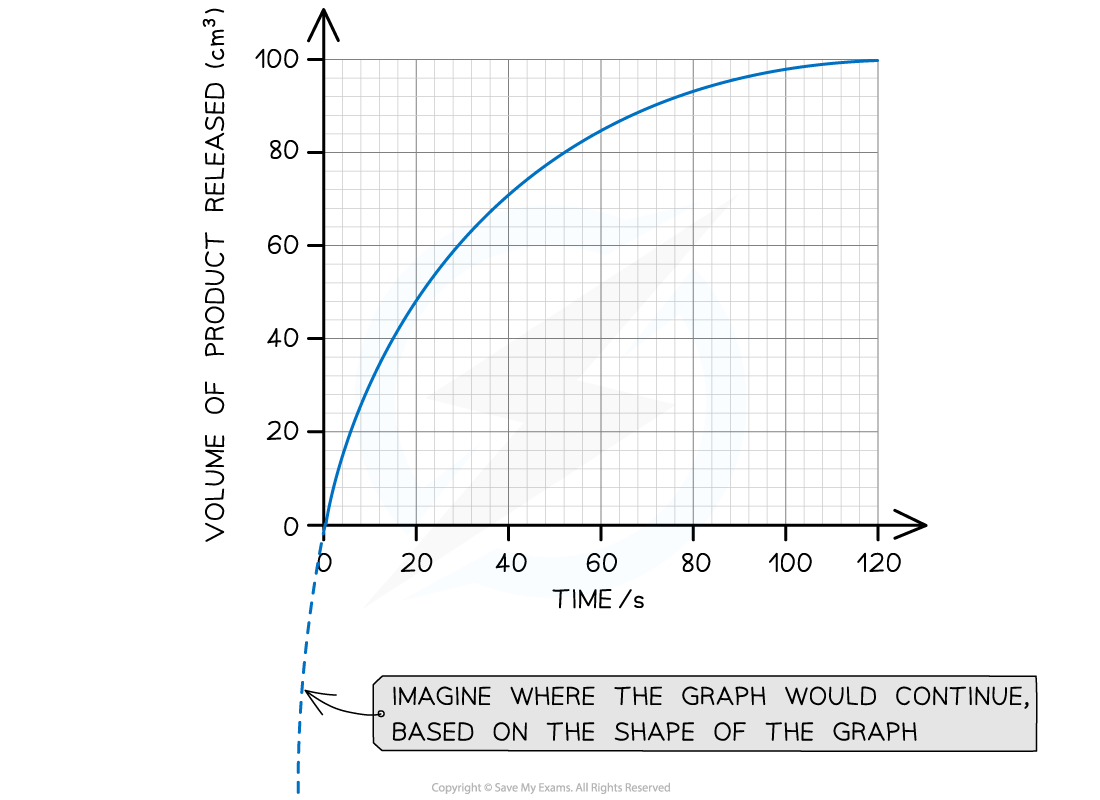
Step 2: Find the tangent to the curve at 0 seconds (the start of the reaction)
Responses