
Biology AS OCR
-
1-1-practical-skills-written-assessment AS7 主题
-
1-2-practical-skills-endorsement-assessment AS16 主题
-
1-2-1-practical-ethical-use-of-organisms as
-
1-2-2-practical-aseptic-techniques as
-
1-2-3-practical-dissection-of-gas-exchange-surfaces-in-fish-and-insects as
-
1-2-4-drawing-cells-from-blood-smears as
-
1-2-5-practical-investigating-biodiversity-using-sampling as
-
1-2-6-practical-data-loggers-and-computer-modelling as
-
1-2-7-practical-investigating-the-rate-of-diffusion as
-
1-2-8-practical-investigating-water-potential as
-
1-2-9-practical-factors-affecting-membrane-structure-and-permeability as
-
1-2-10-biochemical-tests-reducing-sugars-and-starch as
-
1-2-11-biochemical-tests-lipids as
-
1-2-12-biochemical-tests-proteins as
-
1-2-13-chromatography as
-
1-2-14-serial-dilutions as
-
1-2-15-practical-investigating-the-rate-of-transpiration as
-
1-2-16-practical-using-a-light-microscope as
-
1-2-1-practical-ethical-use-of-organisms as
-
2-1-cell-structure AS9 主题
-
2-1-2-using-a-microscope as
-
2-1-3-drawing-cells as
-
2-1-4-magnification-and-resolution as
-
2-1-5-eukaryotic-cells as
-
2-1-6-eukaryotic-cells-under-the-microscope as
-
2-1-7-organelles-and-the-production-of-proteins as
-
2-1-8-the-cytoskeleton as
-
2-1-9-prokaryotic-and-eukaryotic-cells as
-
2-1-1-studying-cells as
-
2-1-2-using-a-microscope as
-
2-2-biological-molecules AS17 主题
-
2-2-1-properties-of-water as
-
2-2-2-monomers-and-polymers as
-
2-2-3-monosaccharides as
-
2-2-4-the-glycosidic-bond as
-
2-2-5-polysaccharides as
-
2-2-6-biochemical-tests-reducing-sugars-and-starch as
-
2-2-7-lipids-and-ester-bonds as
-
2-2-8-lipids-structure-and-function as
-
2-2-9-biochemical-tests-lipids as
-
2-2-10-amino-acids-and-peptide-bonds as
-
2-2-11-protein-structure as
-
2-2-12-globular-proteins as
-
2-2-13-fibrous-proteins as
-
2-2-14-inorganic-ions as
-
2-2-15-biochemical-tests-proteins as
-
2-2-16-finding-the-concentration-of-a-substance as
-
2-2-17-chromatography as
-
2-2-1-properties-of-water as
-
2-3-nucleotides-and-nucleic-acids AS8 主题
-
2-4-enzymes AS9 主题
-
2-4-1-the-role-of-enzymes as
-
2-4-2-enzyme-action as
-
2-4-3-enzyme-activity-ph as
-
2-4-4-enzyme-activity-temperature as
-
2-4-5-enzyme-activity-enzyme-concentration as
-
2-4-6-enzyme-activity-substrate-concentration as
-
2-4-7-enzyme-activity-enzyme-inhibitors as
-
2-4-8-coenzymes-cofactors-and-prosthetic-groups as
-
2-4-9-practical-measuring-enzyme-activity as
-
2-4-1-the-role-of-enzymes as
-
2-5-biological-membranes AS9 主题
-
2-5-1-the-cell-surface-membrane as
-
2-5-2-membrane-structure-and-permeability as
-
2-5-3-diffusion-and-facilitated-diffusion as
-
2-5-4-practical-investigating-the-rate-of-diffusion as
-
2-5-5-active-transport as
-
2-5-6-endocytosis-and-exocytosis as
-
2-5-7-osmosis as
-
2-5-8-osmosis-in-animal-and-plant-cells as
-
2-5-9-practical-investigating-water-potential as
-
2-5-1-the-cell-surface-membrane as
-
2-6-cell-division-cell-diversity-and-cellular-organisation AS11 主题
-
2-6-1-the-cell-cycle as
-
2-6-2-the-stages-of-mitosis as
-
2-6-3-identifying-mitosis-in-plant-cells as
-
2-6-4-the-significance-of-mitosis as
-
2-6-5-the-stages-of-meiosis as
-
2-6-6-the-significance-of-meiosis as
-
2-6-7-specialised-cells as
-
2-6-8-the-organisation-of-cells as
-
2-6-9-stem-cells as
-
2-6-10-stem-cells-in-animals-and-plants as
-
2-6-11-the-use-of-stem-cells as
-
2-6-1-the-cell-cycle as
-
3-1-exchange-surfaces AS7 主题
-
3-2-transport-in-animals AS12 主题
-
3-2-1-the-need-for-transport-systems-in-animals as
-
3-2-2-circulatory-systems as
-
3-2-3-blood-vessels as
-
3-2-4-tissue-fluid as
-
3-2-5-the-mammalian-heart as
-
3-2-6-practical-mammalian-heart-dissection as
-
3-2-7-the-cardiac-cycle as
-
3-2-8-cardiac-output as
-
3-2-9-heart-action-initiation-and-control as
-
3-2-10-electrocardiograms-ecgs as
-
3-2-11-the-role-of-haemoglobin as
-
3-2-12-adult-and-fetal-haemoglobin as
-
3-2-1-the-need-for-transport-systems-in-animals as
-
3-3-transport-in-plants AS11 主题
-
3-3-1-the-need-for-transport-systems-in-plants as
-
3-3-2-the-xylem-and-phloem as
-
3-3-3-the-xylem as
-
3-3-4-the-phloem as
-
3-3-5-transverse-sections-stems-roots-and-leaves as
-
3-3-6-the-process-of-transpiration as
-
3-3-7-transpiration-in-plants as
-
3-3-8-practical-investigating-the-rate-of-transpiration as
-
3-3-9-translocation as
-
3-3-10-the-mass-flow-hypothesis as
-
3-3-11-the-adaptations-of-xerophytic-and-hydrophytic-plants as
-
3-3-1-the-need-for-transport-systems-in-plants as
-
4-1-communicable-diseases-disease-prevention-and-the-immune-system AS16 主题
-
4-1-1-common-pathogens-and-communicable-diseases as
-
4-1-2-transmission-of-communicable-pathogens as
-
4-1-3-plant-defences-against-pathogens as
-
4-1-4-non-specific-immune-responses as
-
4-1-5-phagocytes as
-
4-1-6-blood-cells as
-
4-1-7-the-t-lymphocyte-response as
-
4-1-8-the-b-lymphocyte-response as
-
4-1-9-primary-and-secondary-immune-responses as
-
4-1-10-antibodies as
-
4-1-11-opsonins-agglutinins-and-anti-toxins as
-
4-1-12-types-of-immunity as
-
4-1-13-autoimmune-diseases as
-
4-1-14-principles-of-vaccination as
-
4-1-15-sources-of-medicine as
-
4-1-16-antibiotics as
-
4-1-1-common-pathogens-and-communicable-diseases as
-
4-2-biodiversity AS10 主题
-
4-2-1-biodiversity as
-
4-2-2-sampling-to-determine-biodiversity as
-
4-2-3-practical-investigating-biodiversity-using-sampling as
-
4-2-4-measuring-species-richness-and-species-evenness as
-
4-2-5-simpsons-index as
-
4-2-6-genetic-diversity as
-
4-2-7-factors-affecting-biodiversity as
-
4-2-8-reasons-for-maintaining-biodiversity as
-
4-2-9-methods-of-maintaining-biodiversity as
-
4-2-10-conservation-agreements as
-
4-2-1-biodiversity as
-
4-3-classification-and-evolution AS15 主题
-
4-3-1-classification-of-species as
-
4-3-2-binomial-system as
-
4-3-3-classification-of-the-three-domains as
-
4-3-4-classification-of-the-five-kingdoms as
-
4-3-5-classification-and-phylogeny as
-
4-3-6-evidence-of-evolution as
-
4-3-7-types-of-variation as
-
4-3-8-standard-deviation as
-
4-3-9-variation-t-test-method as
-
4-3-10-variation-t-test-worked-example as
-
4-3-11-spearmans-rank-correlation as
-
4-3-12-adaptation as
-
4-3-13-natural-selection as
-
4-3-14-evolution-of-resistance as
-
4-3-15-consequences-of-resistance as
-
4-3-1-classification-of-species as
1-1-5-presenting-experimental-data as
Exam code:H020
Presenting Experimental Data
-
There are many different types of experiments that can be conducted in biology
-
The data collected from biological experiments can vary greatly across the subject
-
For example, the large amounts of numerical data produced from ecological studies is very different to the drawings produced from microscope slides of live specimens
-
-
The nature of an experiment dictates how the data should be presented
-
It is important that scientists can make the correct judgment when deciding how to present data from an experiment
-
Collecting data
-
Qualitative experiments involve collecting and recording observations
-
Quantitative experiments involve collecting and recording numerical data
-
Recording experimental data in a table is important for any type of experiment
-
The table used will vary considerably depending on the specific requirements
-
-
When constructing such a table:
-
Draw lines with a ruler to separate cells
-
Use appropriate headings
-
Use the correct units and symbols (in the headings, not the cells)
-
The independent variable should be in the first column
-
Any dependent variable readings should be in the subsequent columns
-

Examples of a table that has been correctly constructed for an experiment
Processing data
-
Depending on the type of experiment, data is processed using different methods (before being analysed)
-
Some data does not require any processing, like drawings from life
-
-
Qualitative results can’t be processed mathematically (there isn’t any numerical data) but the observations can be analysed
-
The observations may be compared to a standard or other experimental work
-
-
Quantitative results must be processed using mathematical skills prior to analysis
-
Simple calculations work out means and rates
-
Further calculations are done to obtain information surrounding means (standard deviation and standard error)
-
Statistical tests are performed to better understand the results (chi-squared and t-test etc.)
-
-
In addition to these mathematical calculations, the data can be presented in graphical form
-
Graphs, bar charts, and histograms can be used to display quantitative data
-
The type of graphical format used depends on the data
-
For qualitative and discrete data, bar charts or pie charts are most suitable
-
For continuous data, line graphs or scatter graphs are most suitable
-
-
-
Any graph drawn should have:
-
The appropriate scale with equal intervals
-
Labelled axes with the correct units
-
Straight lines drawn with a ruler
-

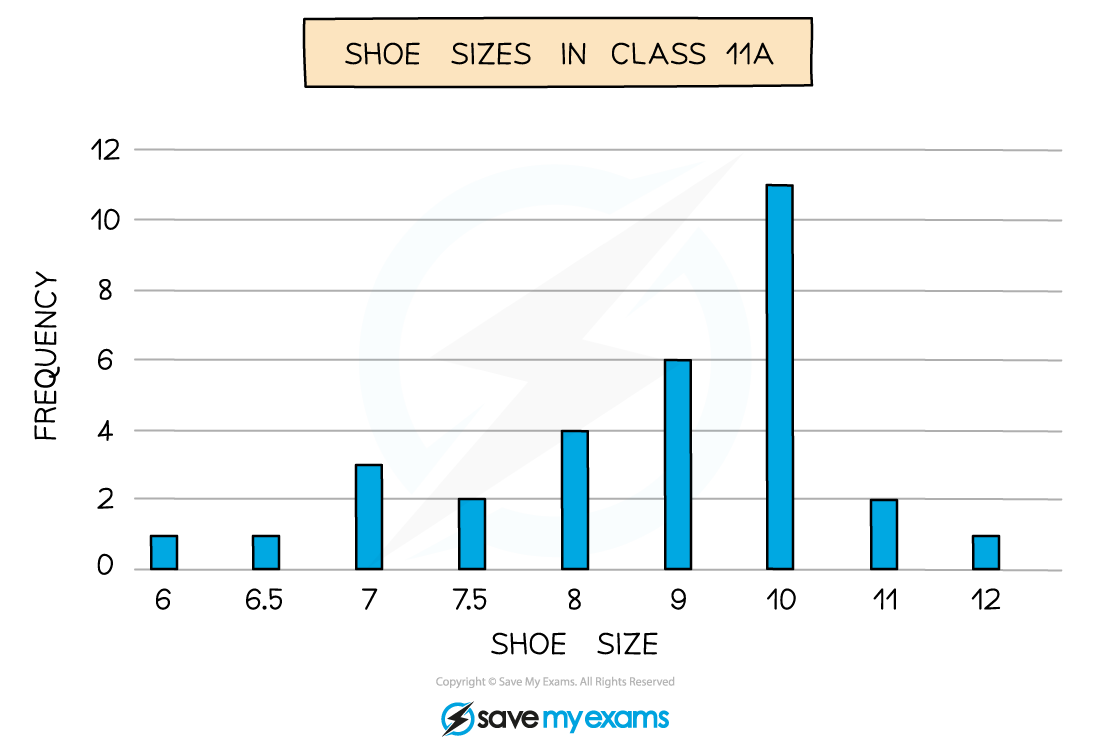
The line graph has been used to display continuous data over time while the bar chart has been used to display grouped data
Precision & Accuracy
-
The certainty of any conclusions made from an experiment are impacted by the precision and accuracy of measurements and data
-
It is a very common mistake to confuse precision with accuracy – measurements can be precise but not accurate if each measurement reading has the same error
-
Precision refers to the ability to take multiple readings with an instrument that are close to each other, whereas accuracy is the closeness of those measurements to the true value
Precision
-
Precise measurements are ones in which there is very little spread about the mean value, in other words, how close the measured values are to each other
-
If a measurement is repeated several times, it can be described as precise when the values are very similar to, or the same as, each other
-
The precision of a measurement is reflected in the values recorded – measurements to a greater number of decimal places are said to be more precise than those to a whole number
-
Random errors cause unpredictable fluctuations in an instrument’s readings as a result of uncontrollable factors, such as environmental conditions
-
This affects the precision of the measurements taken, causing a wider spread of results about the mean value
-
To reduce random error:
-
Repeat measurements several times and calculate an average from them
-
Accuracy
-
A measurement is considered accurate if it is close to the true value
-
Systematic errors arise from the use of faulty instruments used or from flaws in the experimental method
-
This type of error is repeated consistently every time the instrument is used or the method is followed, which affects the accuracy of all readings obtained
-
To reduce systematic errors:
-
Instruments should be recalibrated, or different instruments should be used
-
Corrections or adjustments should be made to the technique
-

The difference between precise and accurate results
Uncertainty
-
Measurements of quantities are made with the aim of finding the true value of that quantity
-
In reality, it is impossible to obtain the true value of any quantity as there will always be a degree of uncertainty
-
Uncertainty is the amount of error your measurements might contain
-
Results from experiments always contain some error (they are never perfect)
-
There will always be a small degree of uncertainty in your readings or measurements
-
This is often because the accuracy and precision of the apparatus being used is limited
-
-
The margins of error of the apparatus are usually displayed on the glassware
-
These margins of error can be used to calculate percentage error
-
Percentage error helps to quantify the margin of error and its possible impact on the results
-
-
For example, you may want to measure a reaction rate by measuring how much of a product is made in a given time period (e.g. using a gas syringe to measure the volume of oxygen produced from the breakdown of hydrogen peroxide by catalase)
-
The gas syringe may only give readings to the nearest 1 cm3
-
The gas syringe has a margin of error of ± 0.05 cm3
-
A ‘±’ sign tells you the range in which the true value lies
-
The real volume produced could be up to 0.05 cm3 smaller or larger
-
-
For experiments, you may need to calculate the percentage error of your measurements
-
As long as you know the uncertainty value of your measurements, the percentage error can be calculated using the following formula:
-
percentage error = (uncertainty value ÷ your measurement) x 100
-
A percentage error less than 5% is considered statistically not significant
Choosing the apparatus with the right resolution
-
Resolution is the smallest change in the quantity being measured of a measuring instrument that gives a perceptible change in the reading
-
For example, the resolution of a wristwatch is 1 s, whereas the resolution of a digital stop-clock is typically 10 ms (0.01 s)
-
In imaging, resolution can also be described as the ability to see two structures as two separate structures rather than as one fuzzy entity
-
When choosing measuring instruments, instruments with an appropriate measuring scale need to be used
-
Smaller measuring instruments have higher resolution scales due to the smaller graduations on the scale. This means they have smaller margins of error
-
For example, measuring 5 cm3 of a liquid using a 500 cm3 measuring cylinder would be very difficult. A 10cm3 measuring cylinder would be a more appropriate choice as the measuring scale is of a higher resolution

Smaller measuring instruments tend to have higher resolution measurements and a smaller margin of error. Make sure to always choose the appropriate instrument for the experiment
Worked Example
In an enzyme rate reaction involving the breakdown of hydrogen peroxide by catalase, 50 cm3 of oxygen was produced, with an uncertainty value of 0.05 cm3. Calculate the percentage error of this measurement.
Answer:
Percentage error = (uncertainty value ÷ your measurement) x 100
Percentage error = (0.05 ÷ 50) x 100
Percentage error = 0.001 x 100
Percentage error = 0.1%
Responses