
Exam code:8BN0
Measuring Biodiversity Within a Habitat
-
The place where an organism lives is called its habitat
-
Habitats can vary in size, with some being very large (e.g. grasslands) while others are very small (e.g. a puddle of water that formed after heavy rain)
-
Measuring the species diversity within different habitats can be useful in making comparisons between them or when studying how habitats change over time
-
One way to determine species diversity is to measure species richness in a habitat
-
Species richness is the number of species within a community
-
A community is a group of populations of different species living in the same place at the same time that interact with each other
-
-
Species richness is the simplest way to measure species diversity
-
A community with a greater number of species will have a greater species richness score
-
For example, a tropical rain forest has a very high number of different species so it would be described as species-rich
-
-
Species richness can be a misleading indicator of diversity as it does not take into account the number of individuals of each species
-
Species abundance is a measure of the relative number of individuals in the different species within a given area
-
In the example below, Area 1 and Area 2 both contain 4 tree species
-
However, Area 2 is actually dominated by one species and in fact, one of the species is very rare (only one individual)
-
Although the two areas have exactly the same species richness, Area 1 has a higher species abundance (and therefore a higher overall species diversity) than Area 2
-
This example illustrates the limitations of using just species richness on its own
-
-
Conservationists often favour the use of an index of diversity as it takes into account species number and evenness

Area 1 and 2 have the same species richness but different species abundance. Area 1 will have a higher overall species diversity as it has a higher species abundance. Species diversity takes both richness and abundance into account.
-
Measuring the different levels of biodiversity within an ecosystem can be challenging
-
Finding out which species live in an ecosystem and the size of the populations requires the identification and cataloguing of all organisms present to build a species list
-
This is possible for areas that are very small or where the species are very large like trees
-
However, for larger and more complex ecosystems like rainforests, it is simply impossible to find, identify and count every organism that exists there
-
When this is the case, different samples of the area can be taken and used to make an estimate for the total species numbers in the area
Random sampling
-
Some ecosystems are very complex with large numbers of different species of different sizes
-
For the sake of logistics, random sampling is often used to estimate the distribution and abundance of species
-
The distribution of a species describes how it is spread throughout the ecosystem
-
The abundance of a species is the number of individuals of that species
-
-
When carrying out sampling, square frames called quadrats can be used to mark off the area being sampled
-
Quadrats are square frames made of wood or wire
-
They can be a variety of sizes eg. 0.25m2 or 1m2
-
They are placed on the ground and the organisms within them are recorded
-
They can be used to measure the distribution and abundance of plants
-
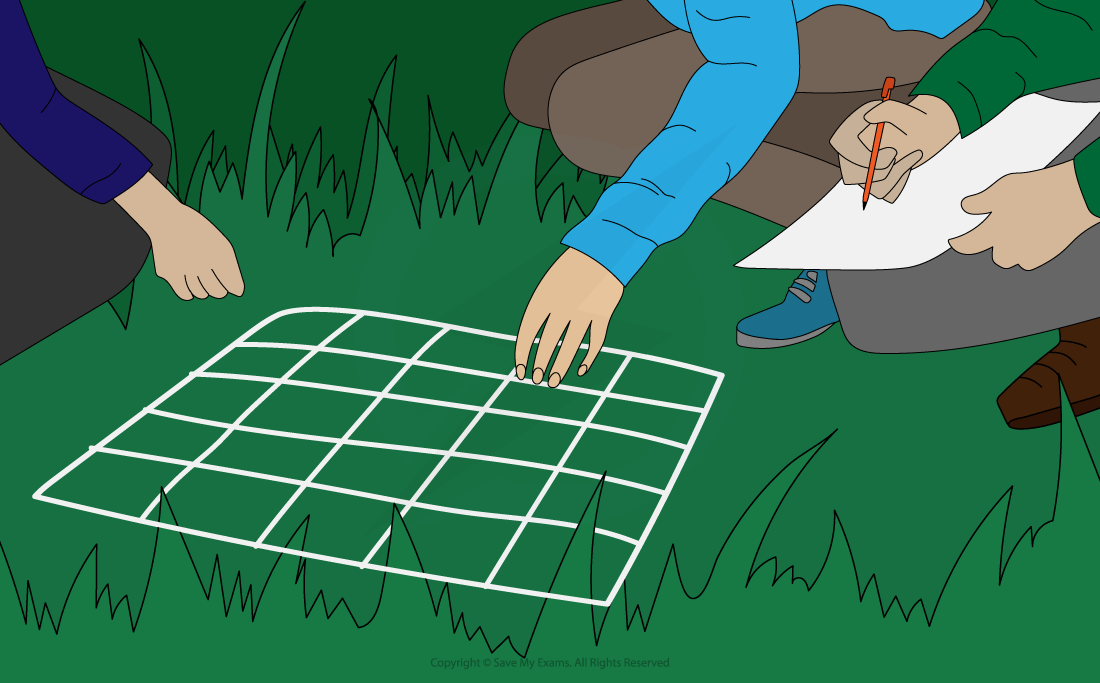
Using a quadrat to investigate population size or distribution
-
Quadrats of different sizes can be used depending on what is being measured and what is most suitable in the space the samples are being made in
-
Quadrats must be laid randomly in the area to avoid sampling bias
-
This random sampling can be done by converting the sampling area into a grid format and labelling each square on the grid with a number
-
Then a random number generator is used to pick the sample points
-
-
Once the quadrat has been laid on the chosen sample point the abundance or percentage cover of all the different species present can be recorded
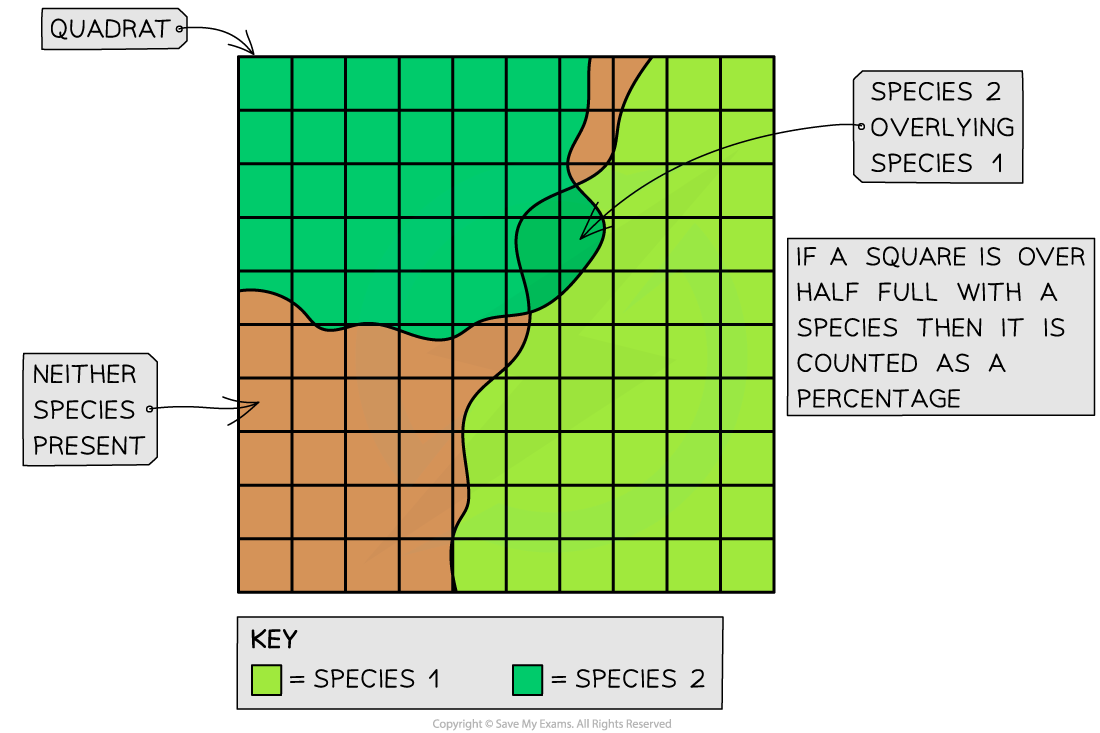
Using a quadrat to investigate the percentage cover of two species of grass. Some squares may be lacking any species while other squares may have multiple species in them – this means that the total percentage cover may sometimes be over or under 100%
-
Quadrats are suitable for sampling plants
-
For many animal species, however, it is not possible to use quadrats to measure their distribution and abundance
-
In these cases, other techniques involving other items of equipment are necessary, including:
-
Sweeping nets: these are large, strong nets with a fine material (very small holes) that are used to catch flying insects and insects that live in long grass by sweeping the net back and forth through the grass
-
Pitfall traps: these are cans or jars that are buried in the ground that are used to catch ground-dwelling (often nocturnal) insects and other invertebrates as they fall into the trap
-
Kick-sampling: this technique is used to catch freshwater invertebrates living in streams or rivers. A net in placed on the stream-bed so that the water is flowing into it and the stream-bed just above the net is churned up by the scientist (using their foot) for a set period of time. The invertebrates are carried by the stream into the net
-
-
Take as many samples as possible to get a more accurate indication of the entire habitat
-
The results can be used to estimate the total number of individuals or species richness in the habitat
-
It is important to use the same sampling method when gathering data to compare different habitats with one another

Example of how a pitfall trap can be used

Example of how kick-sampling is done
Measuring genetic diversity within a species
-
Genetic diversity refers to the different alleles that occur within the gene pool of a species or a population
-
The greater the allele variety within a species, the higher the genetic diversity will be
-
Measurements of genetic diversity is useful to investigate changes occurring in a population over time or when comparing two species with one another
-
To measure genetic diversity two factors can be considered:
-
Phenotype
-
Genotype
-
-
The phenotype of an organism refers to its observable features
-
Different alleles are responsible for the variety of phenotypes that can be observed within a species
-
Therefore, the greater the variety of phenotypes within a species, the higher the genetic diversity
-
An organisms genotype is determined by the different alleles that is found within the cells
-
Different alleles will have a different order of bases in the DNA molecules
-
These base orders can be determined by sequencing the DNA of individuals in a species
-
The higher the number of different alleles for a characteristic, the greater the genetic diversity within that species
-
Another way to determine the genetic diversity within a species is to use the heterozygosity index
Heterozygosity index
-
Organisms that have two different alleles at a particular gene locus are known as heterozygotes
-
The higher the proportion of heterozygotes in a population, the greater the genetic diversity of that population will be
-
We can use the following formula to calculate the heterozygosity index (H):
<img alt=”straight H space equals space fraction numerator number space of space heterozygotes over denominator number space of space individuals space in space the space population end fraction” data-mathml='<math style=”font-family:Arial” ><semantics><mrow><mi mathvariant=”normal”>H</mi><mo> </mo><mo>=</mo><mo> </mo><mfrac><mrow><mi>number</mi><mo> </mo><mi>of</mi><mo> </mo><mi>heterozygotes</mi></mrow><mrow><mi>number</mi><mo> </mo><mi>of</mi><mo> </mo><mi>individuals</mi><mo> </mo><mi>in</mi><mo> </mo><mi>the</mi><mo> </mo><mi>population</mi></mrow></mfrac></mrow><annotation encoding=”application/vnd.wiris.mtweb-params+json”>{“language”:”en”,”fontFamily”:”Times New Roman”,”fontSize”:”18″}</annotation></semantics></math>’ height=”49″ role=”math” src=”data:image/svg+xml;charset=utf8,%3Csvg%20xmlns%3D%22http%3A%2F%2Fwww.w3.org%2F2000%2Fsvg%22%20xmlns%3Awrs%3D%22http%3A%2F%2Fwww.wiris.com%2Fxml%2Fmathml-extension%22%20height%3D%2249%22%20width%3D%22358%22%20wrs%3Abaseline%3D%2231%22%3E%3C!–MathML%3A%20%3Cmath%20xmlns%3D%22http%3A%2F%2Fwww.w3.org%2F1998%2FMath%2FMathML%22%20style%3D%22font-family%3AArial%22%3E%3Cmi%20mathvariant%3D%22normal%22%3EH%3C%2Fmi%3E%3Cmo%3E%26%23xA0%3B%3C%2Fmo%3E%3Cmo%3E%3D%3C%2Fmo%3E%3Cmo%3E%26%23xA0%3B%3C%2Fmo%3E%3Cmfrac%3E%3Cmrow%3E%3Cmi%3Enumber%3C%2Fmi%3E%3Cmo%3E%26%23xA0%3B%3C%2Fmo%3E%3Cmi%3Eof%3C%2Fmi%3E%3Cmo%3E%26%23xA0%3B%3C%2Fmo%3E%3Cmi%3Eheterozygotes%3C%2Fmi%3E%3C%2Fmrow%3E%3Cmrow%3E%3Cmi%3Enumber%3C%2Fmi%3E%3Cmo%3E%26%23xA0%3B%3C%2Fmo%3E%3Cmi%3Eof%3C%2Fmi%3E%3Cmo%3E%26%23xA0%3B%3C%2Fmo%3E%3Cmi%3Eindividuals%3C%2Fmi%3E%3Cmo%3E%26%23xA0%3B%3C%2Fmo%3E%3Cmi%3Ein%3C%2Fmi%3E%3Cmo%3E%26%23xA0%3B%3C%2Fmo%3E%3Cmi%3Ethe%3C%2Fmi%3E%3Cmo%3E%26%23xA0%3B%3C%2Fmo%3E%3Cmi%3Epopulation%3C%2Fmi%3E%3C%2Fmrow%3E%3C%2Fmfrac%3E%3C%2Fmath%3E–%3E%3Cdefs%3E%3Cstyle%20type%3D%22text%2Fcss%22%3E%40font-face%7Bfont-family%3A’math17f39f8317fbdb1988ef4c628eb’%3Bsrc%3Aurl(da
Responses