
Biology AS CIE
-
1-cell-structure10 主题
-
1-2-cells-as-the-basic-units-of-living-organisms AS viruses
-
1-2-cells-as-the-basic-units-of-living-organisms AS prokaryotic-v-eukaryotic-cells
-
1-2-cells-as-the-basic-units-of-living-organisms AS the-vital-role-of-atp
-
1-2-cells-as-the-basic-units-of-living-organisms AS animal-and-plant-cells
-
1-2-cells-as-the-basic-units-of-living-organisms AS eukaryotic-cell-structures-and-functions
-
1-1-the-microscope-in-cell-studies AS calculating-actual-size
-
1-1-the-microscope-in-cell-studies AS resolution-and-magnification
-
1-1-the-microscope-in-cell-studies AS eyepiece-graticules-and-stage-micrometers
-
1-1-the-microscope-in-cell-studies AS magnification-calculations
-
1-1-the-microscope-in-cell-studies AS the-microscope-in-cell-studies
-
1-2-cells-as-the-basic-units-of-living-organisms AS viruses
-
2-biological-molecules19 主题
-
2-4-water AS water-and-the-hydrogen-bond
-
2-4-water AS the-role-of-water-in-living-organisms
-
2-3-proteins AS collagen
-
2-3-proteins AS haemoglobin
-
2-3-proteins AS globular-and-fibrous-proteins
-
2-3-proteins AS protein-shape
-
2-3-proteins AS the-four-levels-of-protein-structure
-
2-3-proteins AS amino-acids-and-the-peptide-bond
-
2-2-carbohydrates-and-lipids AS phospholipids
-
2-2-carbohydrates-and-lipids AS triglycerides
-
2-2-carbohydrates-and-lipids AS cellulose
-
2-2-carbohydrates-and-lipids AS starch-and-glycogen
-
2-2-carbohydrates-and-lipids AS the-glycosidic-bond
-
2-2-carbohydrates-and-lipids AS reducing-and-non-reducing-sugars
-
2-2-carbohydrates-and-lipids AS covalent-bonds-in-polymers
-
2-2-carbohydrates-and-lipids AS biological-molecules-key-terms
-
2-1-testing-for-biological-molecules AS testing-for-non-reducing-sugars
-
2-1-testing-for-biological-molecules AS the-benedicts-test
-
2-1-testing-for-biological-molecules AS biological-molecule-tests
-
2-4-water AS water-and-the-hydrogen-bond
-
3-enzymes13 主题
-
3-2-factors-that-affect-enzyme-action AS enzyme-activity-immobilised-v-free
-
3-2-factors-that-affect-enzyme-action AS enzyme-inhibitors
-
3-2-factors-that-affect-enzyme-action AS vmax-and-the-michaelis-menten-constant
-
3-2-factors-that-affect-enzyme-action AS rate-inhibitor-concentration
-
3-2-factors-that-affect-enzyme-action AS rate-substrate-concentration
-
3-2-factors-that-affect-enzyme-action AS rate-enzyme-concentration
-
3-2-factors-that-affect-enzyme-action AS rate-ph
-
3-2-factors-that-affect-enzyme-action AS rate-temperature
-
3-1-mode-of-action-of-enzymes AS colorimetry
-
3-1-mode-of-action-of-enzymes AS measuring-enzyme-activity
-
3-1-mode-of-action-of-enzymes AS how-enzymes-work
-
3-1-mode-of-action-of-enzymes AS enzyme-action
-
3-1-mode-of-action-of-enzymes AS enzymes
-
3-2-factors-that-affect-enzyme-action AS enzyme-activity-immobilised-v-free
-
4-cell-membranes-and-transport16 主题
-
4-2-movement-into-and-out-of-cells AS comparing-osmosis-in-plants-and-animals
-
4-2-movement-into-and-out-of-cells AS osmosis-in-animals
-
4-2-movement-into-and-out-of-cells AS osmosis-in-plant-cells
-
4-2-movement-into-and-out-of-cells AS estimating-water-potential-in-plants
-
4-2-movement-into-and-out-of-cells AS investigating-surface-area
-
4-2-movement-into-and-out-of-cells AS surface-area-to-volume-ratios
-
4-2-movement-into-and-out-of-cells AS investigating-diffusion
-
4-2-movement-into-and-out-of-cells AS investigating-transport-processes-in-plants
-
4-2-movement-into-and-out-of-cells AS endocytosis-and-exocytosis
-
4-2-movement-into-and-out-of-cells AS active-transport
-
4-2-movement-into-and-out-of-cells AS osmosis
-
4-2-movement-into-and-out-of-cells AS diffusion
-
4-1-fluid-mosaic-membranes AS cell-signalling
-
4-1-fluid-mosaic-membranes AS the-cell-surface-membrane
-
4-1-fluid-mosaic-membranes AS components-of-cell-surface-membranes
-
4-1-fluid-mosaic-membranes AS the-fluid-mosaic-model
-
4-2-movement-into-and-out-of-cells AS comparing-osmosis-in-plants-and-animals
-
5-the-mitotic-cell-cycle8 主题
-
5-2-chromosome-behaviour-in-mitosis AS observing-mitosis
-
5-2-chromosome-behaviour-in-mitosis AS the-stages-of-mitosis
-
5-1-replication-and-division-of-nuclei-and-cells AS how-tumours-form
-
5-1-replication-and-division-of-nuclei-and-cells AS the-role-of-stem-cells
-
5-1-replication-and-division-of-nuclei-and-cells AS the-role-of-telomeres-
-
5-1-replication-and-division-of-nuclei-and-cells AS the-cell-cycle
-
5-1-replication-and-division-of-nuclei-and-cells AS mitosis
-
5-1-replication-and-division-of-nuclei-and-cells AS chromosome-structure
-
5-2-chromosome-behaviour-in-mitosis AS observing-mitosis
-
6-nucleic-acids-and-protein-synthesis9 主题
-
6-2-protein-synthesis AS gene-mutations
-
6-2-protein-synthesis AS transcription
-
6-2-protein-synthesis AS constructing-polypeptides
-
6-2-protein-synthesis AS the-universal-genetic-code
-
6-2-protein-synthesis AS from-gene-to-polypeptide
-
6-1-structure-of-nucleic-acids-and-replication-of-dna AS the-structure-of-rna
-
6-1-structure-of-nucleic-acids-and-replication-of-dna AS semi-conservative-dna-replication
-
6-1-structure-of-nucleic-acids-and-replication-of-dna AS the-structure-of-dna
-
6-1-structure-of-nucleic-acids-and-replication-of-dna AS nucleotides
-
6-2-protein-synthesis AS gene-mutations
-
7-transport-in-plants11 主题
-
7-2-transport-mechanisms AS phloem-mass-flow
-
7-2-transport-mechanisms AS the-sucrose-loading-mechanism
-
7-2-transport-mechanisms AS movement-in-the-phloem
-
7-2-transport-mechanisms AS xerophytic-plant-leaf-adaptations
-
7-2-transport-mechanisms AS water-and-the-transpiration-pull
-
7-2-transport-mechanisms AS transpiration-in-plants
-
7-2-transport-mechanisms AS water-and-mineral-ion-transport-in-plants
-
7-1-structure-of-transport-tissues AS phloem-sieve-tube-elements
-
7-1-structure-of-transport-tissues AS xylem-vessels-elements
-
7-1-structure-of-transport-tissues AS xylem-and-phloem-distribution
-
7-1-structure-of-transport-tissues AS plant-transverse-sections
-
7-2-transport-mechanisms AS phloem-mass-flow
-
8-transport-in-mammals16 主题
-
8-3-the-heart AS heart-action
-
8-3-the-heart AS the-cardiac-cycle
-
8-3-the-heart AS the-walls-of-the-heart
-
8-3-the-heart AS structure-of-the-heart
-
8-2-transport-of-oxygen-and-carbon-dioxide AS the-bohr-shift
-
8-2-transport-of-oxygen-and-carbon-dioxide AS the-oxygen-dissociation-curve
-
8-2-transport-of-oxygen-and-carbon-dioxide AS plasma-and-carbon-dioxide
-
8-2-transport-of-oxygen-and-carbon-dioxide AS the-chloride-shift
-
8-2-transport-of-oxygen-and-carbon-dioxide AS red-blood-cells-haemoglobin-and-oxygen
-
8-1-the-circulatory-system AS blood-tissue-fluid-and-lymph
-
8-1-the-circulatory-system AS the-role-of-water-in-circulation
-
8-1-the-circulatory-system AS cells-of-the-blood
-
8-1-the-circulatory-system AS blood-vessels-structures-and-functions
-
8-1-the-circulatory-system AS observing-and-drawing-blood-vessels
-
8-1-the-circulatory-system AS the-main-blood-vessels
-
8-1-the-circulatory-system AS circulatory-systems
-
8-3-the-heart AS heart-action
-
9-gas-exchange6 主题
-
9-1-the-gas-exchange-system AS gas-exchange-processes
-
9-1-the-gas-exchange-system AS structures-and-functions-of-the-gas-exchange-system
-
9-1-the-gas-exchange-system AS recognising-structures
-
9-1-the-gas-exchange-system AS recognising-tissues
-
9-1-the-gas-exchange-system AS distribution-of-tissues
-
9-1-the-gas-exchange-system AS the-human-gas-exchange-system
-
9-1-the-gas-exchange-system AS gas-exchange-processes
-
10-infectious-diseases6 主题
-
11-immunity10 主题
-
11-2-antibodies-and-vaccination AS vaccination-to-control-disease
-
11-2-antibodies-and-vaccination AS how-vaccines-work
-
11-2-antibodies-and-vaccination AS types-of-immunity
-
11-2-antibodies-and-vaccination AS uses-of-monoclonal-antibodies
-
11-2-antibodies-and-vaccination AS making-monoclonal-antibodies
-
11-2-antibodies-and-vaccination AS antibodies
-
11-1-the-immune-system AS memory-cells-and-immunity
-
11-1-the-immune-system AS primary-immune-response
-
11-1-the-immune-system AS antigens
-
11-1-the-immune-system AS phagocytes
-
11-2-antibodies-and-vaccination AS vaccination-to-control-disease
4-2-movement-into-and-out-of-cells AS investigating-surface-area
Exam code:9700
Investigating SA with agar
-
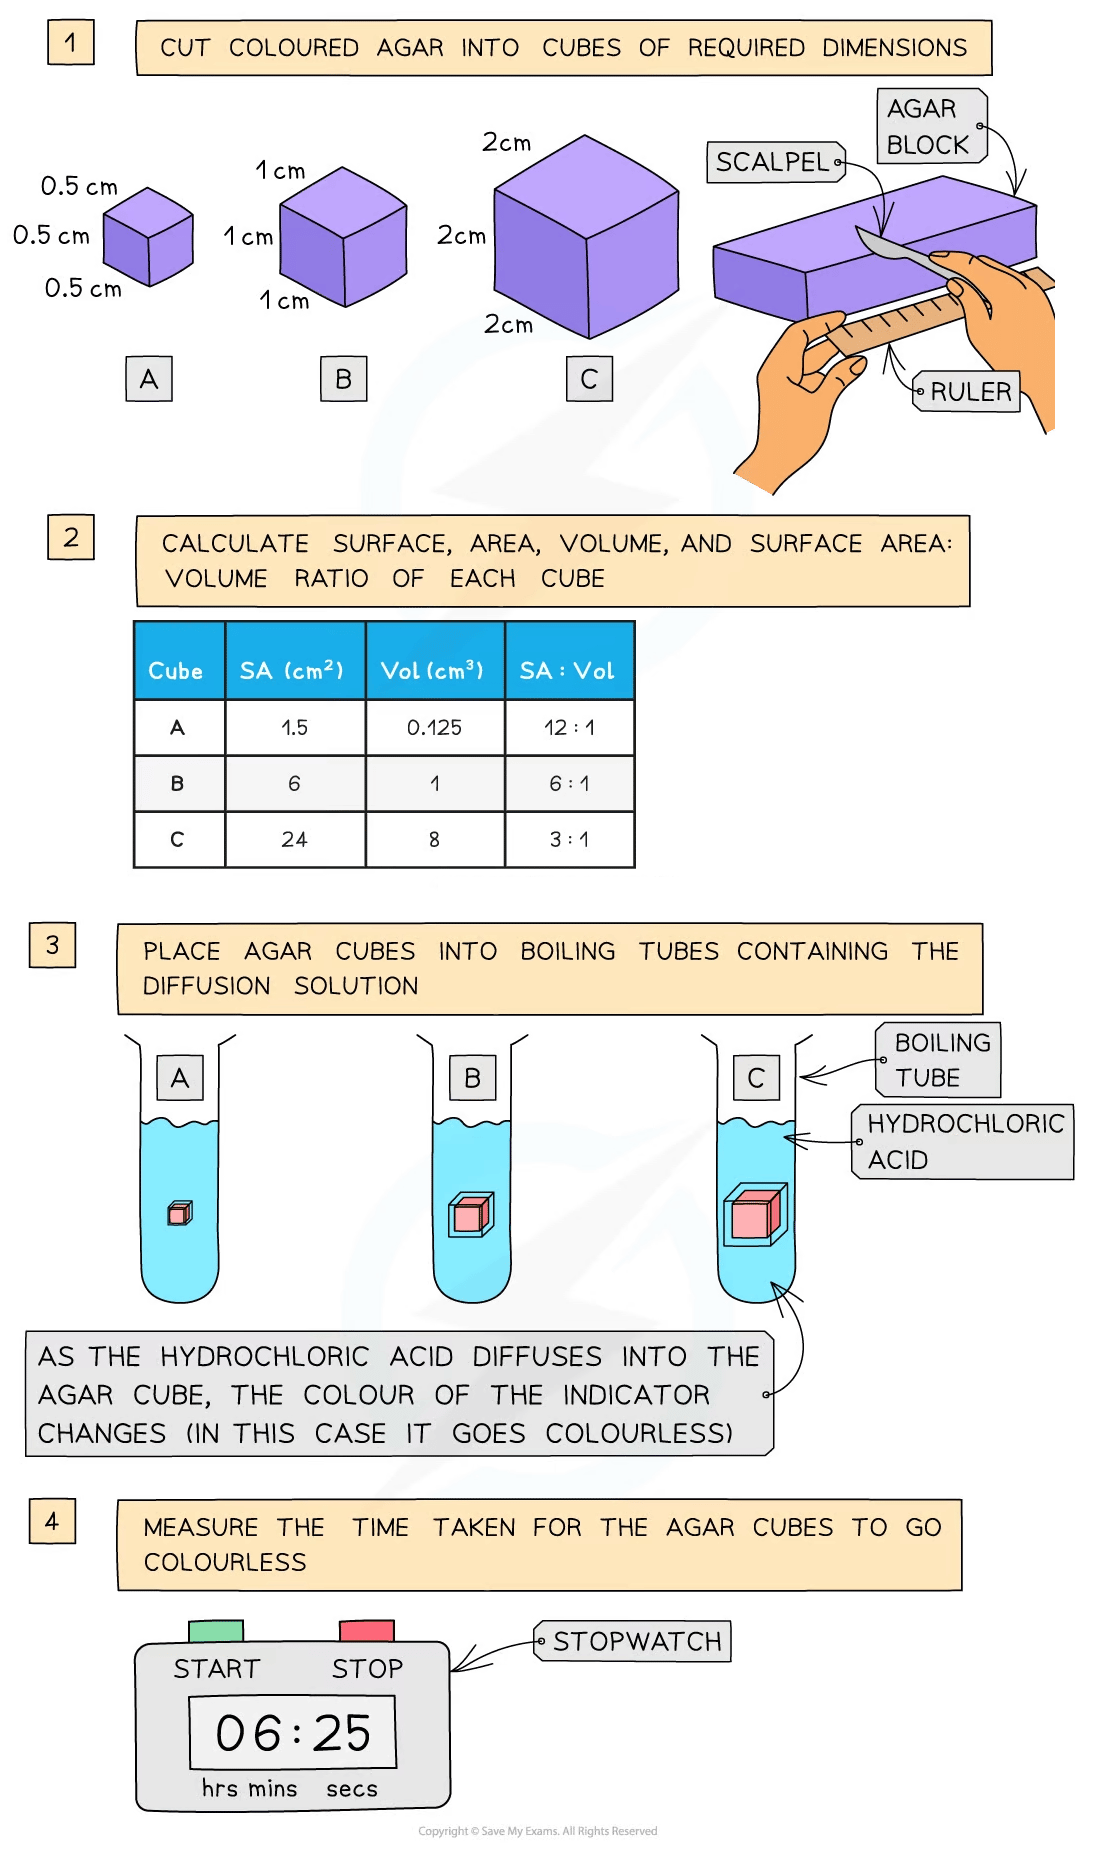
The effect of changing surface area to volume ratio on diffusion can be investigated by timing the diffusion of ions through cubes of agar of different sizes
Method
-
Coloured agar is made up and cut into cubes of the required dimensions (eg. 0.5 cm × 0.5 cm × 0.5 cm, 1 cm × 1 cm × 1 cm and 2 cm × 2 cm × 2 cm)
-
The surface area, volume and surface area to volume ratio of these cubes is calculated and recorded
-
The cubes are then placed into boiling tubes containing a diffusion solution (such as dilute hydrochloric acid)
-
The same volume of dilute hydrochloric acid should be measured carefully into each boiling tube
-
The acid should have higher concentration than the sodium hydroxide so that its diffusion can be monitored by a change in colour of the indicator in the agar blocks
-
-
Measurements can be taken of either:
-
The time taken for the acid to completely change the colour of the indicator in the agar blocks
-
The distance travelled into the block by the acid (shown by the change in colour of the indicator) in a given time (e.g., 5 minutes)
-
Analysis
-
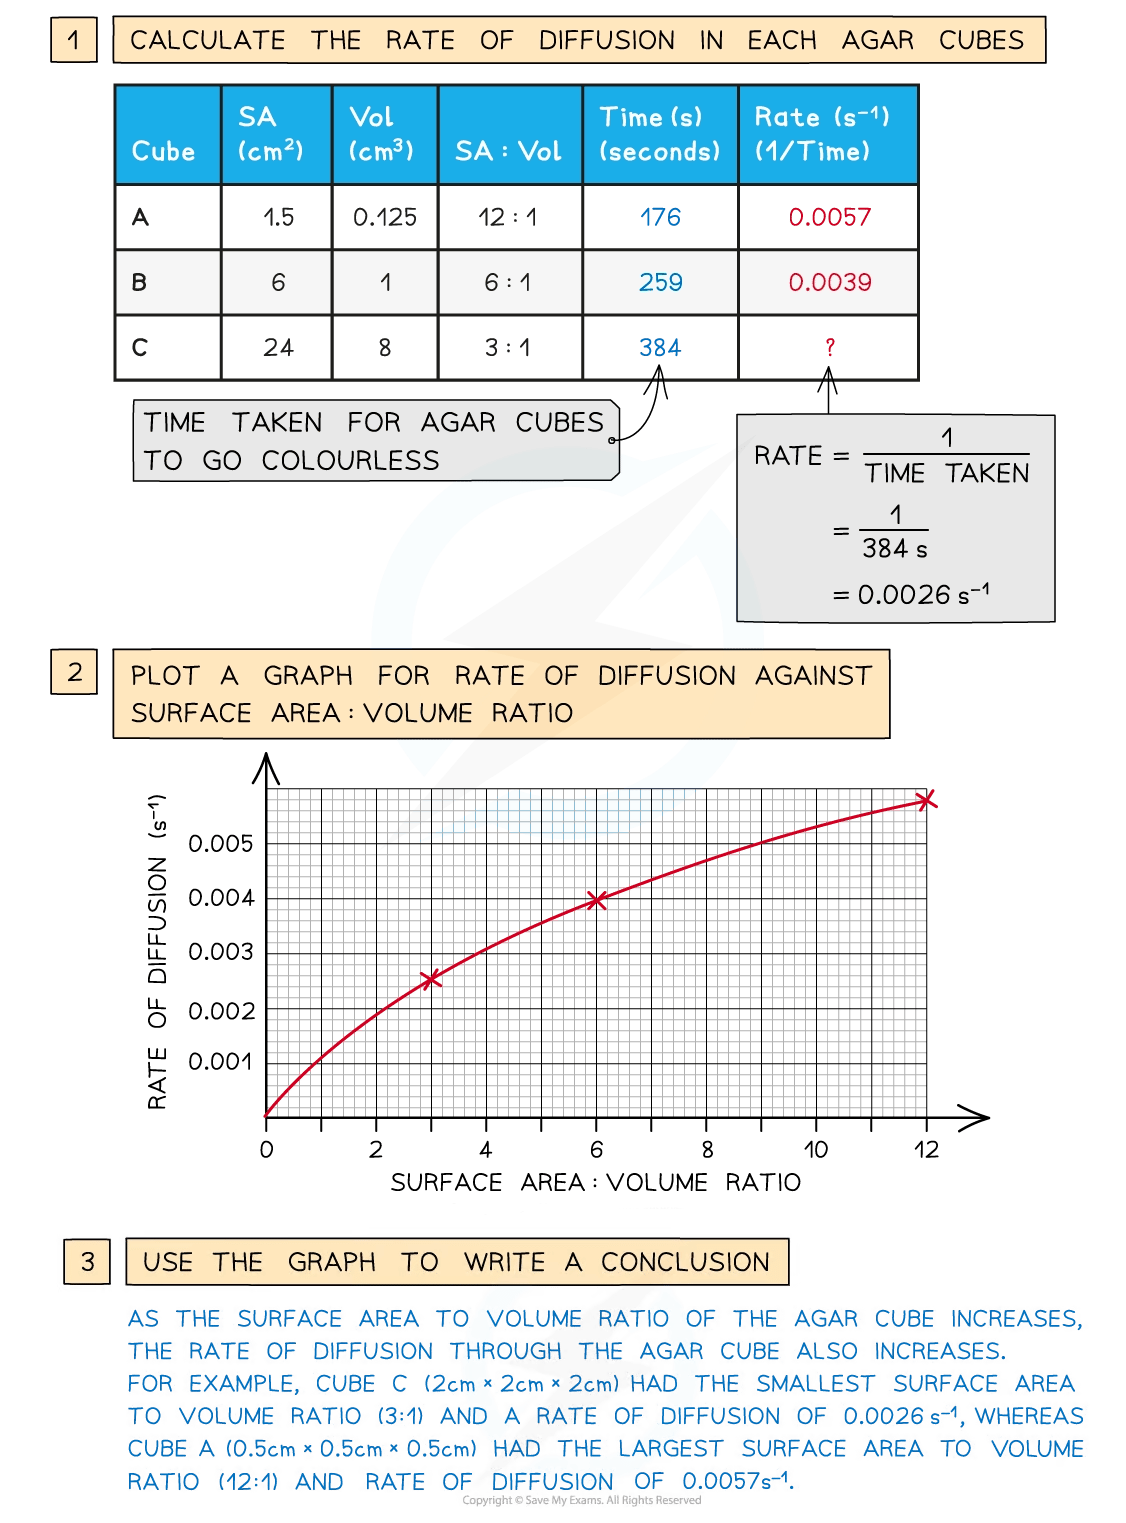
If the time taken for the acid to completely change the colour of the indicator in the agar blocks is recorded, these times can be converted to rates
-
A graph could be plotted showing how the rate of diffusion (rate of colour change) changes with the surface area : volume ratio of the agar cubes
Responses