
Biology AS AQA
-
1-1-biological-molecules-carbohydrates11 主题
-
1-1-1-biological-molecules-key-terms
-
1-1-2-biological-molecules-reactions
-
1-1-3-monosaccharides
-
1-1-4-glucose
-
1-1-5-the-glycosidic-bond
-
1-1-6-chromatography-monosaccharides
-
1-1-7-disaccharides
-
1-1-8-starch-and-glycogen
-
1-1-9-cellulose
-
1-1-10-biochemical-tests-sugars-and-starch
-
1-1-11-finding-the-concentration-of-glucose
-
1-1-1-biological-molecules-key-terms
-
1-2-biological-molecules-lipids3 主题
-
1-3-biological-molecules-proteins5 主题
-
1-4-proteins-enzymes12 主题
-
1-4-1-many-proteins-are-enzymes
-
1-4-2-enzyme-specificity
-
1-4-3-how-enzymes-work
-
1-4-4-required-practical-measuring-enzyme-activity
-
1-4-5-drawing-a-graph-for-enzyme-rate-experiments
-
1-4-6-using-a-tangent-to-find-initial-rate-of-reaction
-
1-4-7-limiting-factors-affecting-enzymes-temperature
-
1-4-8-limiting-factors-affecting-enzymes-ph
-
1-4-10-limiting-factors-affecting-enzymes-enzyme-concentration
-
1-4-11-limiting-factors-affecting-enzymes-substrate-concentration
-
1-4-12-limiting-factors-affecting-enzymes-inhibitors
-
1-4-14-control-of-variables-and-uncertainty
-
1-4-1-many-proteins-are-enzymes
-
1-5-nucleic-acids-structure-and-dna-replication8 主题
-
1-5-2-nucleotide-structure-and-the-phosphodiester-bond
-
1-5-3-dna-structure-and-function
-
1-5-4-rna-structure-and-function
-
1-5-5-ribosomes
-
1-5-6-the-origins-of-research-on-the-genetic-code
-
1-5-8-the-process-of-semi-conservative-replication
-
1-5-9-calculating-the-frequency-of-nucleotide-bases
-
1-5-10-the-watson-crick-model
-
1-5-2-nucleotide-structure-and-the-phosphodiester-bond
-
1-6-atp-water-and-inorganic-ions4 主题
-
2-1-cell-structure7 主题
-
2-2-the-microscope-in-cell-studies4 主题
-
2-3-cell-division-in-eukaryotic-and-prokaryotic-cells8 主题
-
2-4-cell-membranes-and-transport9 主题
-
2-4-1-the-structure-of-cell-membranes
-
2-4-3-the-cell-surface-membrane
-
2-4-4-diffusion
-
2-4-5-osmosis
-
2-4-7-osmosis-in-animal-cells
-
2-4-9-required-practical-investigating-water-potential
-
2-4-10-active-transport-and-co-transport
-
2-4-11-adaptations-for-rapid-transport
-
2-4-13-required-practical-factors-affecting-membrane-permeability
-
2-4-1-the-structure-of-cell-membranes
-
2-5-cell-recognition-and-the-immune-system7 主题
-
2-6-vaccines-disease-and-monoclonal-antibodies6 主题
-
3-1-adaptations-for-gas-exchange6 主题
-
3-2-human-gas-exchange14 主题
-
3-2-5-the-alveolar-epithelium
-
3-2-1-the-human-gas-exchange-system
-
3-2-2-dissecting-the-gas-exchange-system
-
3-2-3-microscopy-and-gas-exchange-surfaces
-
3-2-4-investigating-gas-exchange
-
3-5-5-investigating-heart-rate
-
3-5-6-blood-vessels
-
3-5-7-capillaries-and-tissue-fluid
-
3-5-8-cardiovascular-disease-data
-
3-2-10-risk-factor-data
-
3-2-11-correlations-and-causal-relationships
-
3-2-6-ventilation-and-gas-exchange
-
3-2-8-the-effects-of-lung-disease
-
3-2-9-pollution-and-smoking-data
-
3-2-5-the-alveolar-epithelium
-
3-3-digestion-and-absorption5 主题
-
3-4-mass-transport-in-animals6 主题
-
3-5-the-circulatory-system-in-animals4 主题
-
3-6-mass-transport-in-plants6 主题
-
4-1-dna-genes-and-chromosomes10 主题
-
4-2-dna-and-protein-synthesis3 主题
-
4-3-genetic-diversity-mutations-and-meiosis7 主题
-
4-4-genetic-diversity-and-adaptation6 主题
-
4-5-species-and-taxonomy4 主题
-
4-6-biodiversity9 主题
4-4-2-using-logarithms-when-investigating-bacteria
Exam code:7401
Using logarithms when investigating bacteria
-
Bacterial colonies can grow at rapid rates when in culture, with very large numbers of bacteria produced within hours
-
Dealing with the experimental data relating to large numbers of bacteria can be difficult when using traditional linear scales
-
There is a wide range of very small and very large numbers
-
This makes it hard to work out a suitable scale for the axes of graphs
-
-
Logarithmic scales can be very useful when investigating bacteria
Orders of magnitude
-
Logarithmic scales allow for a wide range of values to be displayed on a single graph
-
An order of magnitude means a tenfold (×10) change in quantity
-
When you’re working with logarithmic scales, especially base 10 (log₁₀), each unit step represents one order of magnitude
Example: yeast cells
-
Yeast cells were grown in culture over several hours. The number of cells increased very rapidly from the original number of cells present
-
The results from the experiment are shown in the graph below, using a log scale
-
The number of yeast cells present at each time interval was converted to a logarithm before being plotted on the graph
-
The log scale is easily identifiable as there are not equal intervals between the numbers on the y-axis
-
The wide range of cell numbers fits easily onto the same scale
-

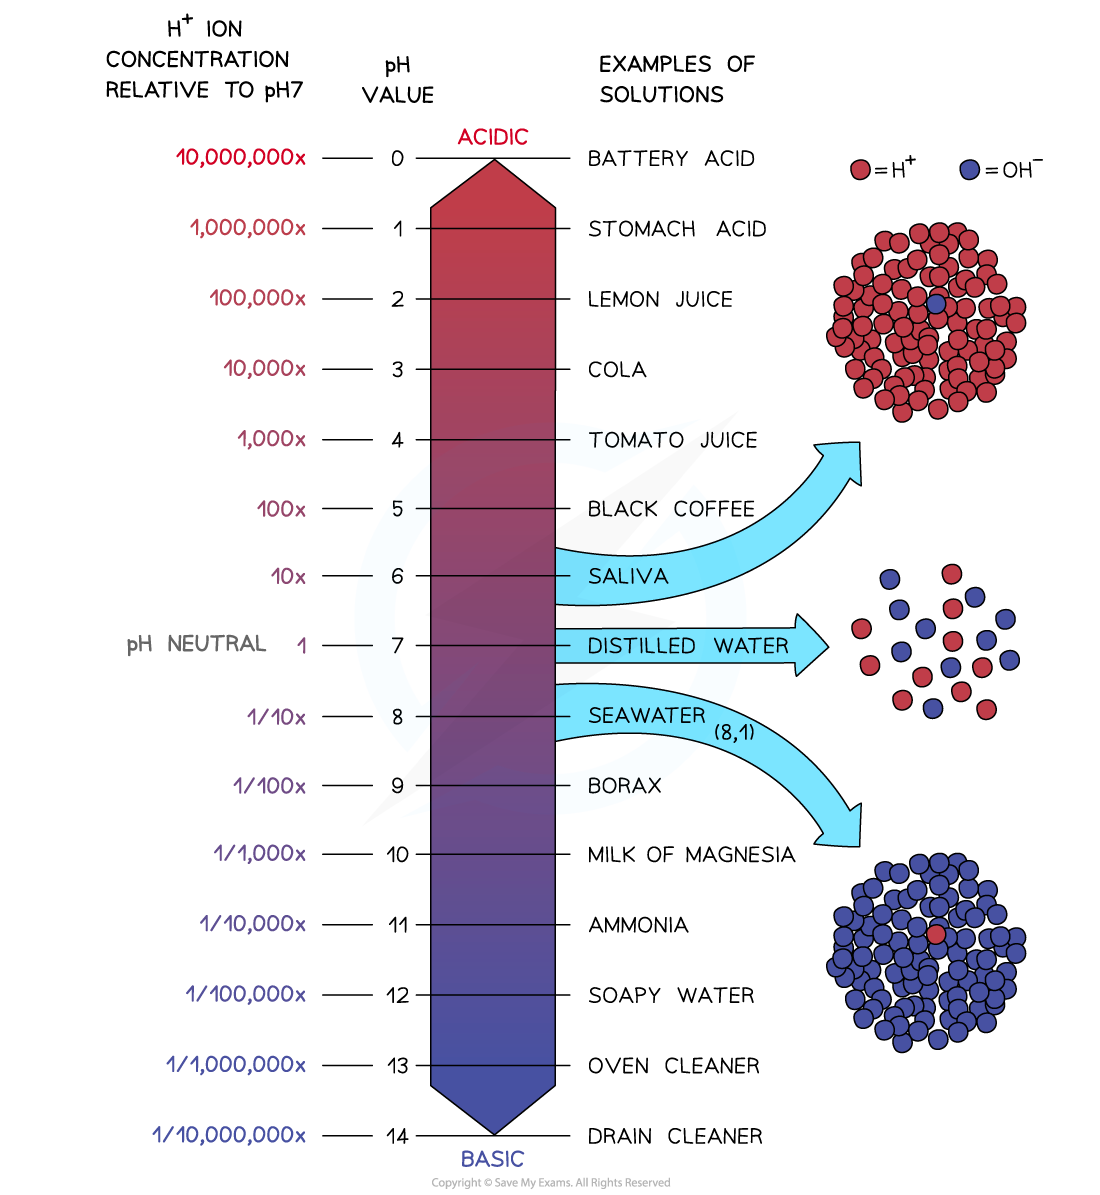
Example: pH scale
-
The pH scale is logarithmic
-
The concentration of hydrogen ions varies massively between each pH level
-
Examiner Tips and Tricks
You won’t be expected to convert values into logarithms or create a log scale graph in the exam. Instead, you might be asked to interpret results that use logarithmic scales or explain the benefit of using one. Remember that graphs with a logarithmic scale have uneven intervals between values on one or more axes.
Responses