
Biology AS AQA
-
1-1-biological-molecules-carbohydrates11 主题
-
1-1-1-biological-molecules-key-terms
-
1-1-2-biological-molecules-reactions
-
1-1-3-monosaccharides
-
1-1-4-glucose
-
1-1-5-the-glycosidic-bond
-
1-1-6-chromatography-monosaccharides
-
1-1-7-disaccharides
-
1-1-8-starch-and-glycogen
-
1-1-9-cellulose
-
1-1-10-biochemical-tests-sugars-and-starch
-
1-1-11-finding-the-concentration-of-glucose
-
1-1-1-biological-molecules-key-terms
-
1-2-biological-molecules-lipids3 主题
-
1-3-biological-molecules-proteins5 主题
-
1-4-proteins-enzymes12 主题
-
1-4-1-many-proteins-are-enzymes
-
1-4-2-enzyme-specificity
-
1-4-3-how-enzymes-work
-
1-4-4-required-practical-measuring-enzyme-activity
-
1-4-5-drawing-a-graph-for-enzyme-rate-experiments
-
1-4-6-using-a-tangent-to-find-initial-rate-of-reaction
-
1-4-7-limiting-factors-affecting-enzymes-temperature
-
1-4-8-limiting-factors-affecting-enzymes-ph
-
1-4-10-limiting-factors-affecting-enzymes-enzyme-concentration
-
1-4-11-limiting-factors-affecting-enzymes-substrate-concentration
-
1-4-12-limiting-factors-affecting-enzymes-inhibitors
-
1-4-14-control-of-variables-and-uncertainty
-
1-4-1-many-proteins-are-enzymes
-
1-5-nucleic-acids-structure-and-dna-replication8 主题
-
1-5-2-nucleotide-structure-and-the-phosphodiester-bond
-
1-5-3-dna-structure-and-function
-
1-5-4-rna-structure-and-function
-
1-5-5-ribosomes
-
1-5-6-the-origins-of-research-on-the-genetic-code
-
1-5-8-the-process-of-semi-conservative-replication
-
1-5-9-calculating-the-frequency-of-nucleotide-bases
-
1-5-10-the-watson-crick-model
-
1-5-2-nucleotide-structure-and-the-phosphodiester-bond
-
1-6-atp-water-and-inorganic-ions4 主题
-
2-1-cell-structure7 主题
-
2-2-the-microscope-in-cell-studies4 主题
-
2-3-cell-division-in-eukaryotic-and-prokaryotic-cells8 主题
-
2-4-cell-membranes-and-transport9 主题
-
2-4-1-the-structure-of-cell-membranes
-
2-4-3-the-cell-surface-membrane
-
2-4-4-diffusion
-
2-4-5-osmosis
-
2-4-7-osmosis-in-animal-cells
-
2-4-9-required-practical-investigating-water-potential
-
2-4-10-active-transport-and-co-transport
-
2-4-11-adaptations-for-rapid-transport
-
2-4-13-required-practical-factors-affecting-membrane-permeability
-
2-4-1-the-structure-of-cell-membranes
-
2-5-cell-recognition-and-the-immune-system7 主题
-
2-6-vaccines-disease-and-monoclonal-antibodies6 主题
-
3-1-adaptations-for-gas-exchange6 主题
-
3-2-human-gas-exchange14 主题
-
3-2-5-the-alveolar-epithelium
-
3-2-1-the-human-gas-exchange-system
-
3-2-2-dissecting-the-gas-exchange-system
-
3-2-3-microscopy-and-gas-exchange-surfaces
-
3-2-4-investigating-gas-exchange
-
3-5-5-investigating-heart-rate
-
3-5-6-blood-vessels
-
3-5-7-capillaries-and-tissue-fluid
-
3-5-8-cardiovascular-disease-data
-
3-2-10-risk-factor-data
-
3-2-11-correlations-and-causal-relationships
-
3-2-6-ventilation-and-gas-exchange
-
3-2-8-the-effects-of-lung-disease
-
3-2-9-pollution-and-smoking-data
-
3-2-5-the-alveolar-epithelium
-
3-3-digestion-and-absorption5 主题
-
3-4-mass-transport-in-animals6 主题
-
3-5-the-circulatory-system-in-animals4 主题
-
3-6-mass-transport-in-plants6 主题
-
4-1-dna-genes-and-chromosomes10 主题
-
4-2-dna-and-protein-synthesis3 主题
-
4-3-genetic-diversity-mutations-and-meiosis7 主题
-
4-4-genetic-diversity-and-adaptation6 主题
-
4-5-species-and-taxonomy4 主题
-
4-6-biodiversity9 主题
3-5-4-the-cardiac-cycle
Exam code:7401
The cardiac cycle
-
The cardiac cycle is the series of events that take place in one heart beat, including muscle contraction and relaxation
-
The contraction of the heart is called systole, while the relaxation of the heart is called diastole
-
-
Volume changes occur in the heart during the cardiac cycle
-
Contraction of the heart muscle causes a decrease in volume in the corresponding chamber of the heart, which then increases again when the muscle relaxes
-
-
Volume changes lead to corresponding pressure changes
-
When volume decreases, pressure increases
-
When volume increases, pressure decreases
-
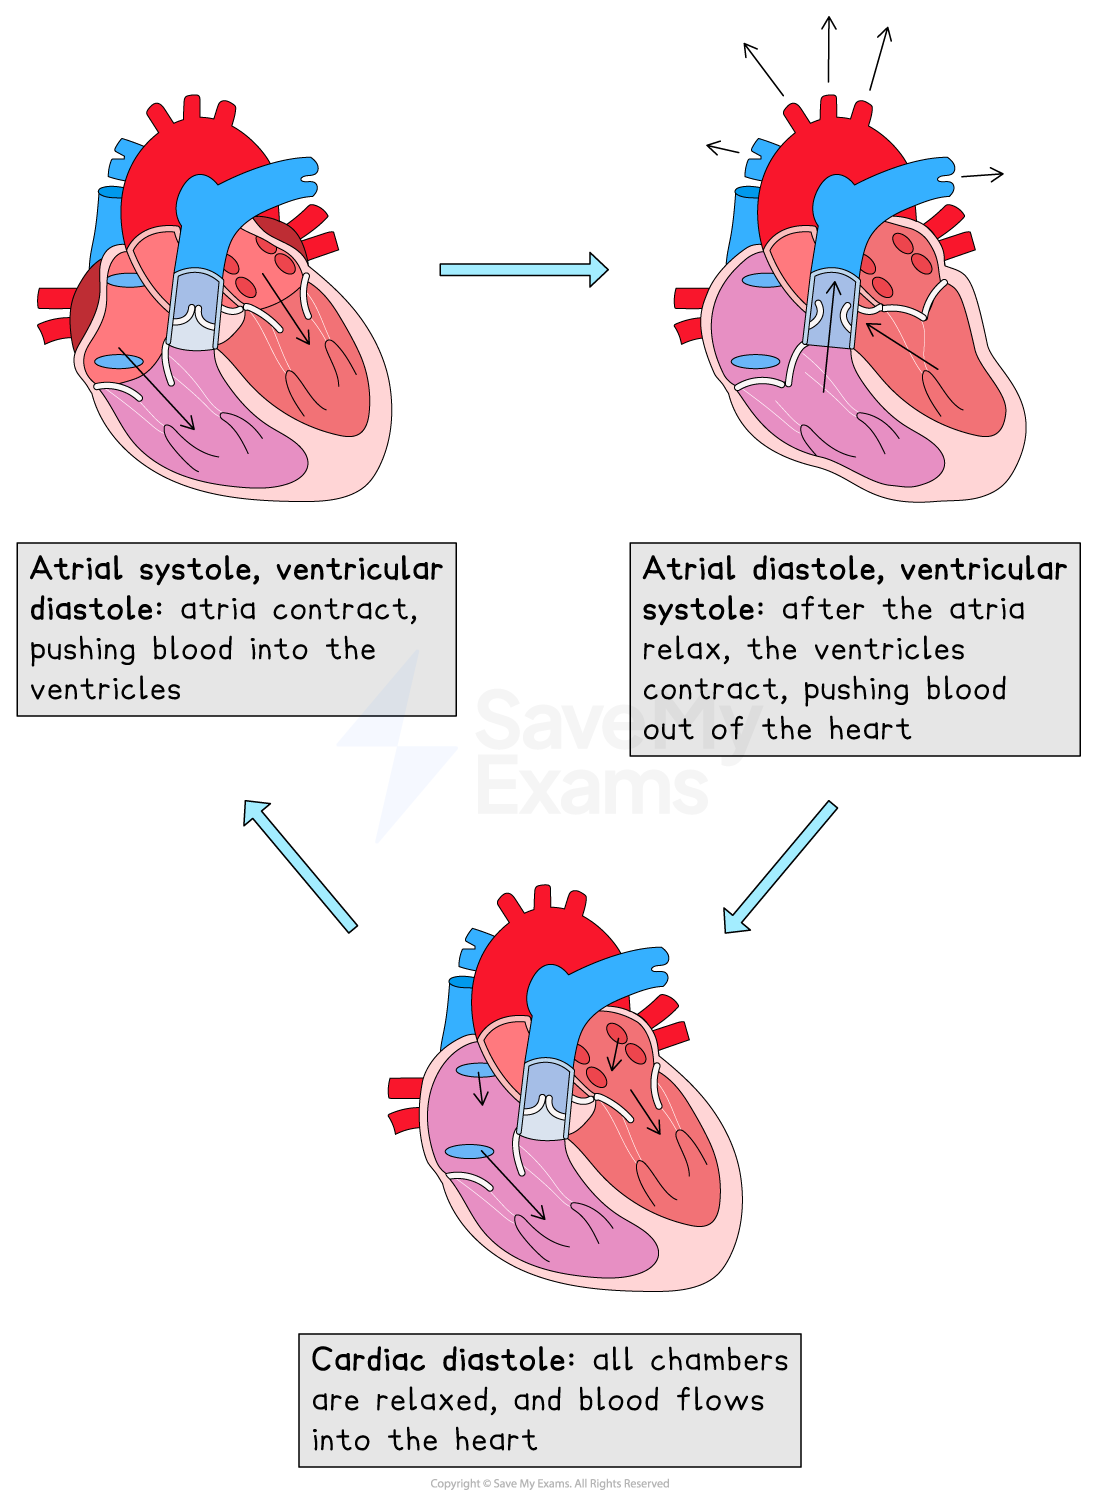
The events of the cardiac cycle
Atrial systole
-
The walls of the atria contract
-
Atrial volume decreases
-
Atrial pressure increases
-
-
The pressure in the atria rises above that in the ventricles, forcing the atrioventricular (AV) valves open
-
Blood is forced into the ventricles
-
There is a slight increase in ventricular pressure and chamber volume as the ventricles receive the blood from the atria
-
-
The ventricles are relaxed at this point; ventricular diastole coincides with atrial systole
Ventricular systole
-
The walls of the ventricles contract
-
Ventricular volume decreases
-
Ventricular pressure increases
-
-
The pressure in the ventricles rises above that in the atria
-
The AV valves are forced to close, preventing back flow of blood
-
-
The pressure in the ventricles rises above that in the aorta and pulmonary artery
-
The semilunar (SL) valves are forced open so blood is forced into the arteries and out of the heart
-
-
During this period:
-
the atria are relaxing; atrial diastole coincides with ventricular systole
-
the blood flow to the heart continues, so the relaxed atria begin to fill with blood again
-
Diastole
-
The ventricles and atria are both relaxed
-
The pressure in the ventricles drops below that in the aorta and pulmonary artery, forcing the SL valves to close
-
The atria continue to fill with blood
-
Blood returns to the heart via the vena cava and pulmonary vein
-
-
Pressure in the atria rises above that in the ventricles, forcing the AV valves open
-
Blood flows passively into the ventricles without need for atrial systole
-
The cycle then begins again with atrial systole
Valve movements during the cardiac cycle
-
Pressure changes cause the valves to open and close in different regions of the heart
-
Valves open when the pressure of blood behind them is greater than the pressure in front of them
-
They close when the pressure of blood in front of them is greater than the pressure behind them
-
|
Stage in cardiac cycle |
Atrioventricular valves |
Semilunar valves |
|---|---|---|
|
Atrial systole |
Open |
Closed |
|
Ventricular systole |
Closed |
Open |
|
Diastole |
Open |
Closed |
Analysing data relating to the cardiac cycle
-
The changes that occur during the cardiac cycle can be shown on a graph, e.g.:
-
The lines on the graph below represent the pressure of the left atrium, aorta, and the left ventricle
-
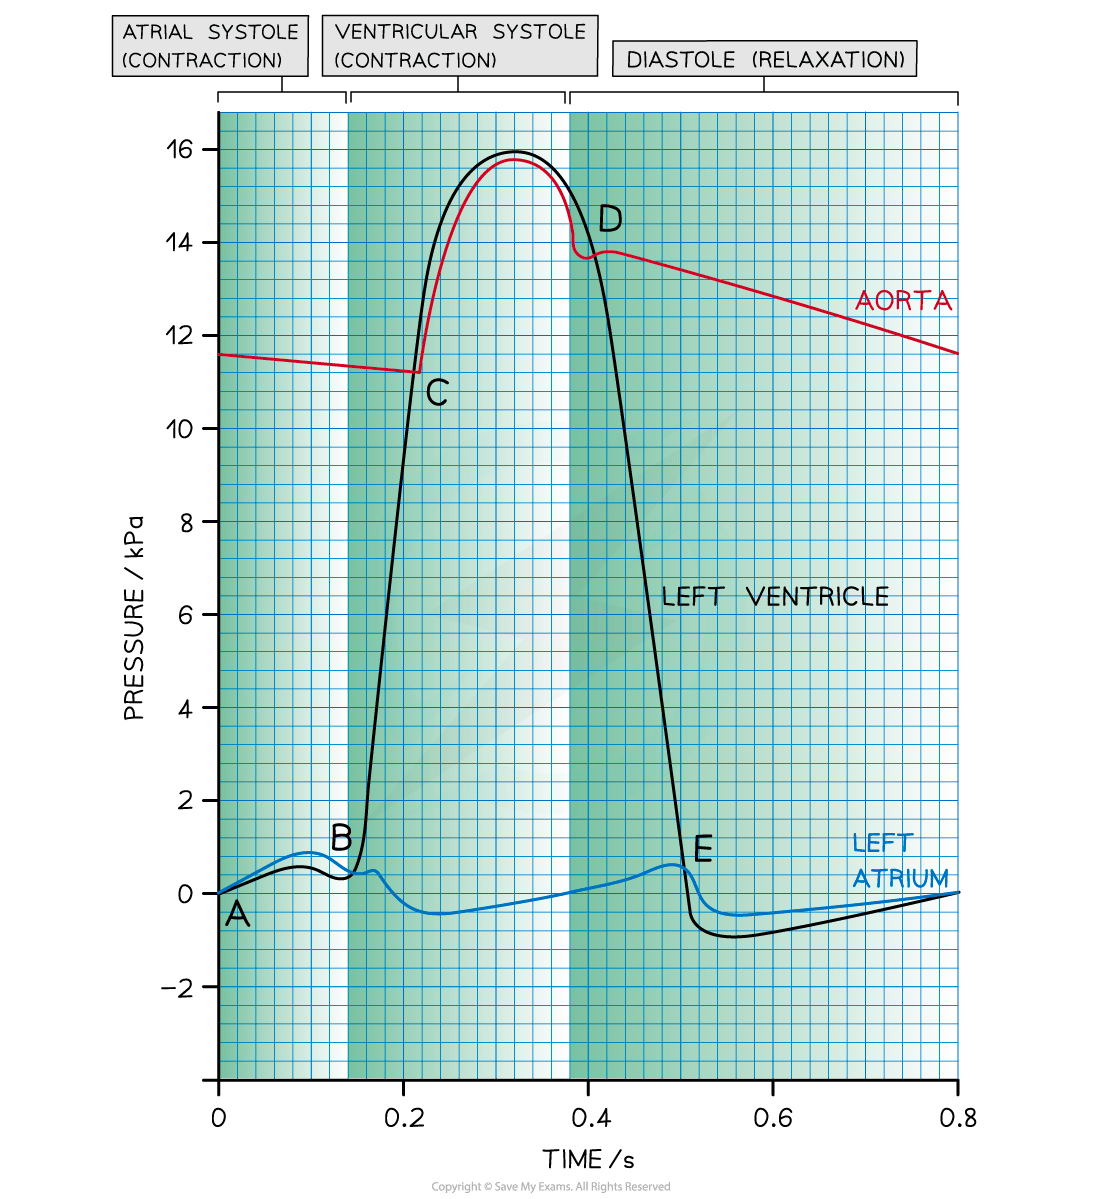
Interpreting the cardiac cycle graph
-
Point A: the end of diastole
-
The atrium has filled with blood during the preceding diastole
-
Pressure is higher in the atrium than in the ventricle, so the AV valve is open
-
-
Point A-B: atrial systole
-
Left atrium contracts, causing an increase in atrial pressure and forcing blood into the left ventricle
-
Ventricular pressure increases slightly as it fills with blood
-
Pressure is higher in the atrium than in the ventricle, so the AV valve is open
-
-
Point B: beginning of ventricular systole
-
Left ventricle contracts causing the ventricular pressure to increase
-
Pressure in the left atrium drops as the muscle relaxes
-
Pressure in the ventricle exceeds pressure in the atrium, so the AV valve shuts
-
-
Point C: ventricular systole
-
The ventricle continues to contract
-
Pressure in the left ventricle exceeds that in the aorta
-
Aortic valve opens and blood is forced into the aorta
-
-
Point D: beginning of diastole
-
Left ventricle has been emptied of blood
-
Muscles in the walls of the left ventricle relax and pressure falls below that in the newly filled aorta
-
Aortic valve closes
-
-
Point D-E: early diastole
-
The ventricle remains relaxed and ventricular pressure continues to decrease
-
In the meantime, blood is flowing into the relaxed atrium from the pulmonary vein, causing an increase in pressure
-
-
Point E: diastole
-
The relaxed left atrium fills with blood, causing the pressure in the atrium to exceed that in the newly emptied ventricle
-
AV valve opens
-
-
After point E: late diastole
-
There is a short period of time during which the left ventricle expands due to relaxing muscles
-
This increases the internal volume of the left ventricle and decreases the ventricular pressure
-
At the same time, blood is flowing slowly through the newly opened AV valve into the left ventricle, causing a brief decrease in pressure in the left atrium
-
The pressure in both the atrium and ventricle then increases slowly as they continue to fill with blood
-
Worked Example
The graph below shows the cardiac cycle.
Calculate the heart rate of this person. Give your answer in beats per minute.

Answer:
Step 1: work out the length of one heart beat
-
It takes 0.7 seconds for completion of one cardiac cycle, which is one heart beat
1 cycle = 0.7 seconds
Step 2: calculate how many heart beats occur per second
-
Determine the number of times 0.7 fits into 1 second
1 ![]() 0.7 = 1.43 beats per second
0.7 = 1.43 beats per second
Step 3: calculate how many heart beats occur per minute
-
1 minute = 60 seconds
1.43 x 60 = 85.71 beats beats / min
Examiner Tips and Tricks
Make sure that you can point out the times on a cardiac cycle graph at which different valves are opening and closing.
Responses