
Exam code:1ST0
Cumulative Frequency
What is cumulative frequency?
-
Cumulative refers to a “running total” or “adding up as you go along”
-
So in a table of grouped data
-
cumulative frequency means all of the frequencies for the different groups totalled up to the end of the group in a given row
-
-
When working out cumulative frequencies you may see tables presented in two ways
-
A regular grouped data table with an extra column for cumulative frequencies
-
e.g. rows labelled 0 ≤ x < 20, 20 ≤ x < 40, 40 ≤ x < 60, etc
frequency
cumulative frequency
0 ≤ x < 20
14
14
20 ≤ x < 40
25
39
(because 14+25=39)
40 ≤ x < 60
29
68
(because 14+25+29=68)
60 ≤ x < 80
12
80
(because 14+25+29+12=80)
-
-
or a separate table where every group is relabelled as starting at the beginning (often zero)
-
e.g. rows labelled 0 ≤ x < 20, 0 ≤ x < 40, 0 ≤ x < 60, etc.
-
or x < 20, x < 40, x < 60, etc.
cumulative frequency
0 ≤ x < 20
(or x < 20)
14
0 ≤ x < 40
(or x < 40)
39
0 ≤ x < 60
(or x < 60)
68
0 ≤ x < 80
(or x < 80)
80
-
-
In the second type of table, you can subtract to find the individual frequencies
-
e.g. the frequency of the 20 ≤ x < 40 class interval is 39-14=25
-
the frequency of the 40 ≤ x < 60 class interval is 68-39=29
-
etc.
-
-
Cumulative Frequency Step Polygons
What is a cumulative frequency step polygon?
-
A cumulative frequency step polygon is a way of representing discrete data
-
For grouped continuous data a cumulative frequency diagram would be used instead
-
How do I draw a cumulative frequency step polygon?
-
This is best explained with an example
-
The numbers of eggs found in each nest in a survey of 50 American alligator nests are shown in the table below:
Number of eggs
Frequency
29
5
30
6
31
11
32
15
33
7
34
6
Total
50
-
Then the cumulative frequency is the running total of the frequencies
Number of eggs
Frequency
Cumulative Frequency
29
5
5
30
6
5 + 6 = 11
31
11
11 + 11 = 22
32
15
22 + 15 = 37
33
7
37 + 7 = 44
34
6
44 + 6 = 50
Total
50
-
-
We can now draw the cumulative frequency step polygon
-
The cumulative frequency will always go on the vertical axis
-
The values in the data set will appear along the horizontal axis
-
-
The cumulative frequency is zero until we get to 29 eggs
-
So start at the point (29, 0)
-
-
Then the cumulative frequency jumps up to 5
-
Draw a vertical line from (29, 0) to (29, 5) to show this jump
-
-
Nothing changes until we get to 30 eggs
-
Draw a horizontal line from (29, 5) to (30, 5) to show this
-
-
At 30 eggs the cumulative frequency jumps up to 11
-
Draw a vertical line from (30, 5) to (30, 11) to show this jump
-
-
Continue the same way through the rest of the values in the table
-
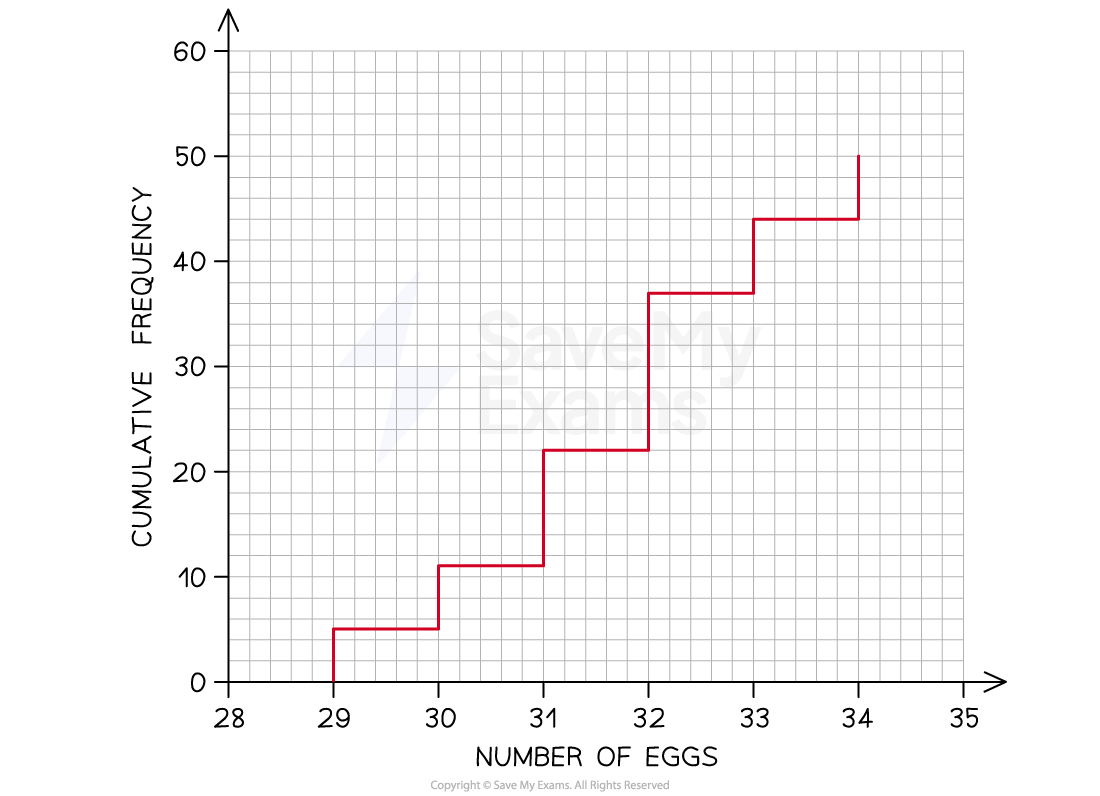
The graph will end at the point (34, 50)
-
-
-
Here is the final cumulative frequency diagram for the numbers of eggs
Cumulative Frequency Diagrams
What is a cumulative frequency diagram?
-
A cumulative frequency diagram is a way of representing grouped continuous data
-
For discrete data a cumulative frequency step polygon would be used instead
-
-
A cumulative frequency diagram can be used to estimate other statistical values
-
For example the median, quartiles or percentiles
-
How do I draw a cumulative frequency diagram?
-
This is best explained with an example
-
The times taken to complete a short general knowledge quiz taken by 50 students are shown in the table below:
Time taken (
 seconds)
Frequency
format('truetype')%3Bfont-weight%3Anormal%3Bfont-style%3Anormal%3B%7D%3C%2Fstyle%3E%3C%2Fdefs%3E%3Ctext%20font-family%3D%22Times%20New%20Roman%22%20font-size%3D%2218%22%20text-anchor%3D%22middle%22%20x%3D%229.5%22%20y%3D%2216%22%3E25%3C%2Ftext%3E%3Ctext%20font-family%3D%22math1d3114856d6c6df443e3168d768%22%20font-size%3D%2216%22%20text-anchor%3D%22middle%22%20x%3D%2226.5%22%20y%3D%2216%22%3E%26%23x2264%3B%3C%2Ftext%3E%3Ctext%20font-family%3D%22Times%20New%20Roman%22%20font-size%3D%2218%22%20font-style%3D%22italic%22%20text-anchor%3D%22middle%22%20x%3D%2237.5%22%20y%3D%2216%22%3Es%3C%2Ftext%3E%3Ctext%20font-family%3D%22math1d3114856d6c6df443e3168d768%22%20font-size%3D%2216%22%20text-anchor%3D%22middle%22%20x%3D%2250.5%22%20y%3D%2216%22%3E%26lt%3B%3C%2Ftext%3E%3Ctext%20font-family%3D%22Times%20New%20Roman%22%20font-size%3D%2218%22%20text-anchor%3D%22middle%22%20x%3D%2267.5%22%20y%3D%2216%22%3E30%3C%2Ftext%3E%3C%2Fsvg%3E)
3
<img alt=”30 less or equal than s less than 35″ data-mathml='<math ><semantics><mrow><mn>30</mn><mo>≤</mo><mi>s</mi><mo><</mo><mn>35</mn></mrow><annotation encoding=”application/vnd.wiris.mtweb-params+json”>{“language”:”en”,”fontFamily”:”Times New Roman”,”fontSize”:”18″,”autoformat”:true}</annotation></semantics></math>’ role=”math” src=”data:image/svg+xml;charset=utf8,%3Csvg%20xmlns%3D%22http%3A%2F%2Fwww.w3.org%2F2000%2Fsvg%22%20xmlns%3Awrs%3D%22http%3A%2F%2Fwww.wiris.com%2Fxml%2Fmathml-extension%22%20height%3D%2222%22%20width%3D%2277%22%20wrs%3Abaseline%3D%2216%22%3E%3C!–MathML%3A%20%3Cmath%20xmlns%3D%22http%3A%2F%2Fwww.w3.org%2F1998%2FMath%2FMathML%22%3E%3Cmn%3E30%3C%2Fmn%3E%3Cmo%3E%26%23×2264%3B%3C%2Fmo%3E%3Cmi%3Es%3C%2Fmi%3E%3Cmo%3E%26lt%3B%3C%2Fmo%3E%3Cmn%3E35%3C%2Fmn%3E%3C%2Fmath%3E–%3E%3Cdefs%3E%3Cstyle%20type%3D%22text%2Fcss%22%3E%40font-face%7Bfont-family%3A’math1d3114856d6c6df443e3168d768’%3Bsrc%3Aurl(data%3Afont%2Ftruetype%3Bcharset%3Dutf-8%3Bbase64%2CAAEAAAAMAIAAAwBAT1MvMi7iBBMAAADMAAAATmNtYXDEvmKUAAABHAAAADxjdnQgDVUNBwAAAVgAAAA6Z2x5ZoPi2VsAAAGUAAABNWhlYWQQC2qxAAACzAAAADZoaGVhCGsXSAAAAwQAAAAkaG10eE2rRkcAAAMoAAAADGxvY2EAHTwYAAADNAAAABBtYXhwBT0FPgAAA0QAAAAgbmFtZaBxlY4AAANkAAABn3Bvc3QB9wD6AAAFBAAAACBwcmVwa1uragAABSQAAAAUAAADSwGQAAUAAAQABAAAAAAABAAEAAAAAAAAAQEAAAAAAAAAAAAAAAAAAAAAAAAAAAAAAAAAAAAAACAgICAAAAAg1UADev96AAAD6ACWAAAAAAACAAEAAQAAABQAAwABAAAAFAAEACgAAAAGAAQAAQACADwiZP%2F%2FAAAAPCJk%2F%2F%2F%2Fxd2eAAEAAAAAAAAAAAFUAywAgAEAAFYAKgJYAh4BDgEsAiwAWgGAAoAAoADUAIAAAAAAAAAAKwBVAIAAqwDVAQABKwAHAAAAAgBVAAADAAOrAAMABwAAMxEhESUhESFVAqv9qwIA%2FgADq%2FxVVQMAAAIAgABVAoACqwAFAAsAbBiwQRoAsQAAExCxAAbksQABExCwCTyxAQX1sAo8sAAQsQUD9bECBe2xBAP1sQMF7bAKELELA%2FWxCAXtsQYD9bEHBe0BsAwQsQED9rIJAAo8PDyxBQT1sgIICzw8PLEEBPWyBgcDPDw8sQ0D5hMHBRc1JwE1DQEXN4EBAQD%2F%2FwEA%2FwD%2FAAH%2FAatWgIBWgAEqVoCAVoAAAwCA%2F6sCgAKrAAMABwALAC8YAQCxCQA%2FsQgF5LECBfSxAQT0sQYF9LEDBOSxBQT0sQQF9LEHARA8sQA
-
Responses