
Maths Gcse Edexcel Higher
-
Scatter-Graphs-And-Correlation Edexcel Higher2 主题
-
Cumulative-Frequency-And-Box-Plots Edexcel Higher4 主题
-
Histograms Edexcel Higher3 主题
-
Statistical-Diagrams Edexcel Higher7 主题
-
Averages-Ranges-And-Data Edexcel Higher8 主题
-
Capture-Recapture Edexcel Higher
-
Population-And-Sampling Edexcel Higher
-
Comparing-Data-Sets Edexcel Higher
-
Range-And-Interquartile-Range Edexcel Higher
-
Averages-From-Grouped-Data Edexcel Higher
-
Averages-From-Tables Edexcel Higher
-
Calculations-With-The-Mean Edexcel Higher
-
Mean-Median-And-Mode Edexcel Higher
-
Capture-Recapture Edexcel Higher
-
Combined-And-Conditional-Probability Edexcel Higher3 主题
-
Tree-Diagrams Edexcel Higher1 主题
-
Simple-Probability-Diagrams Edexcel Higher3 主题
-
Transformations Edexcel Higher5 主题
-
Vectors Edexcel Higher6 主题
-
3D-Pythagoras-And-Trigonometry Edexcel Higher1 主题
-
Sine-Cosine-Rule-And-Area-Of-Triangles Edexcel Higher4 主题
-
Pythagoras-And-Trigonometry Edexcel Higher4 主题
-
Area-And-Volume-Of-Similar-Shapes Edexcel Higher1 主题
-
Congruence-Similarity-And-Geometrical-Proof Edexcel Higher5 主题
-
Volume-And-Surface-Area Edexcel Higher3 主题
-
Circles-Arcs-And-Sectors Edexcel Higher2 主题
-
Area-And-Perimeter Edexcel Higher4 主题
-
Circle-Theorems Edexcel Higher7 主题
-
Circle-Theorem-Proofs Edexcel Higher
-
The-Alternate-Segment-Theorem Edexcel Higher
-
Angles-In-The-Same-Segment Edexcel Higher
-
Angles-In-Cyclic-Quadrilaterals Edexcel Higher
-
Theorems-With-Chords-And-Tangents Edexcel Higher
-
Angle-In-A-Semicircle Edexcel Higher
-
Angles-At-Centre-And-Circumference Edexcel Higher
-
Circle-Theorem-Proofs Edexcel Higher
-
Bearings-Scale-Drawing-Constructions-And-Loci Edexcel Higher5 主题
-
Angles-In-Polygons-And-Parallel-Lines Edexcel Higher3 主题
-
Symmetry-And-Shapes Edexcel Higher6 主题
-
Exchange-Rates-And-Best-Buys Edexcel Higher2 主题
-
Standard-And-Compound-Units Edexcel Higher5 主题
-
Direct-And-Inverse-Proportion Edexcel Higher2 主题
-
Problem-Solving-With-Ratios Edexcel Higher2 主题
-
Ratios Edexcel Higher3 主题
-
Sequences Edexcel Higher4 主题
-
Transformations-Of-Graphs Edexcel Higher2 主题
-
Graphing-Inequalities Edexcel Higher2 主题
-
Solving-Inequalities Edexcel Higher2 主题
-
Real-Life-Graphs Edexcel Higher4 主题
-
Estimating-Gradients-And-Areas-Under-Graphs Edexcel Higher2 主题
-
Equation-Of-A-Circle Edexcel Higher2 主题
-
Graphs-Of-Functions Edexcel Higher6 主题
-
Linear-Graphs Edexcel Higher4 主题
-
Coordinate-Geometry Edexcel Higher4 主题
-
Functions Edexcel Higher3 主题
-
Forming-And-Solving-Equations Edexcel Higher3 主题
-
Iteration Edexcel Higher1 主题
-
Simultaneous-Equations Edexcel Higher2 主题
-
Quadratic-Equations Edexcel Higher4 主题
-
Linear-Equations Edexcel Higher1 主题
-
Algebraic-Proof Edexcel Higher1 主题
-
Rearranging-Formulas Edexcel Higher2 主题
-
Algebraic-Fractions Edexcel Higher4 主题
-
Completing-The-Square Edexcel Higher1 主题
-
Factorising Edexcel Higher6 主题
-
Expanding-Brackets Edexcel Higher3 主题
-
Algebraic-Roots-And-Indices Edexcel Higher1 主题
-
Introduction Edexcel Higher7 主题
-
Using-A-Calculator Edexcel Higher1 主题
-
Surds Edexcel Higher2 主题
-
Rounding-Estimation-And-Bounds Edexcel Higher2 主题
-
Fractions-Decimals-And-Percentages Edexcel Higher3 主题
-
Simple-And-Compound-Interest-Growth-And-Decay Edexcel Higher4 主题
-
Percentages Edexcel Higher3 主题
-
Fractions Edexcel Higher4 主题
-
Powers-Roots-And-Standard-Form Edexcel Higher4 主题
-
Prime-Factors-Hcf-And-Lcm Edexcel Higher4 主题
-
Number-Operations Edexcel Higher10 主题
-
Product-Rule-For-Counting Edexcel Higher
-
Systematic-Lists Edexcel Higher
-
Related-Calculations Edexcel Higher
-
Multiplication-And-Division Edexcel Higher
-
Addition-And-Subtraction Edexcel Higher
-
Money-Calculations Edexcel Higher
-
Negative-Numbers Edexcel Higher
-
Irrational-Numbers Edexcel Higher
-
Order-Of-Operations-Bidmas-Bodmas Edexcel Higher
-
Mathematical-Symbols Edexcel Higher
-
Product-Rule-For-Counting Edexcel Higher
Box-Plots Edexcel Higher
Exam code:1MA1
Box plots
What are box plots and when should they be used?
-
Box plots are also known as box-and-whisker diagrams
-
They are used when we are interested in splitting data up into quartiles
-
Often, data will contain extreme values
-
consider the cost of a car: there are far more family cars around than there are expensive sports cars
-
if you had 50 data values about the prices of cars and 49 of them were family cars but 1 was a sports car
-
the sports car’s value would not fit in with the rest of the data
-
-
-
Using quartiles and drawing a box plot allows us to split the data
-
we can see what is happening at the low, middle and high points
-
and consider any possible extreme values
-
How do I draw a box plot?
-
You need to know five values to draw a box plot
-
Lowest data value
-
Lower quartile
-
Median
-
Upper quartile
-
Highest data value
-
-
Usually on graph paper, box plots are drawn accurately with the five points marked by short vertical lines
-
the middle three values then form a box with the median line inside
-
the median will not necessarily be in the middle of the box!
-
-
the box represents the interquartile range (middle 50% of the data)
-
the lowest data value and highest data value are joined to the box by horizontal lines
-
these are often called whiskers
-
they represent the lowest 25% of the data and the highest 25% of the data
-
-
-
You may be given a box plot
-
from which you can read off the five values
-
calculate other statistics like the range and interquartile range (IQR)
-

How do I compare box plots?
-
If you are asked to compare box plots aim for two pairs of comments
-
the first pair of comments should mention average – i.e. the median
-
the first comment should compare the value of the medians
e.g. the median for boys (12) is greater than the median for girls (8) -
the second comment should explain it in the context of the question
e.g. the boys were, on average, 4 seconds slower than the girls
-
-
the second pair of comments should mention spread – i.e. the interquartile range (or range)
-
the first comment should compare the value of the IQRs
e.g. the IQR for boys (6) is lower than the IQR for girls (9) -
the second comment should explain it in the context of the question
e.g. the boys times were less spread out than the girls, the boys were more consistent
-
-
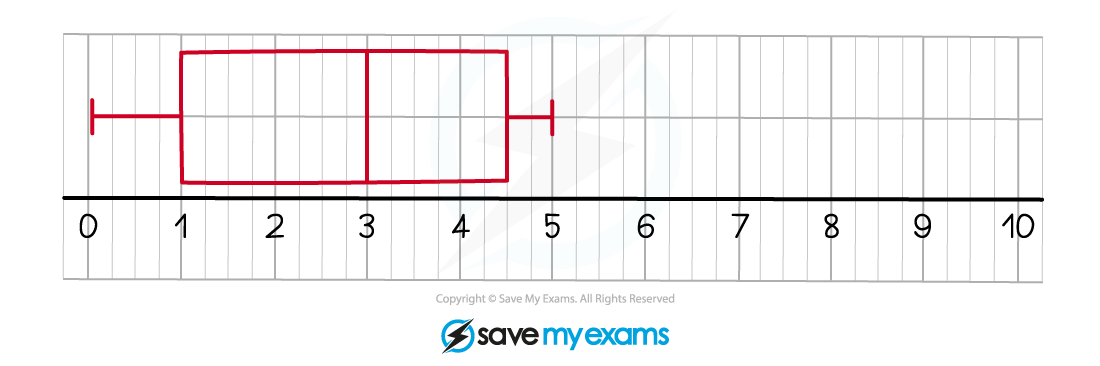
Worked Example
The box plot below shows the number of goals scored per game by Albion Rovers during a football season.
The information below shows the number of goals scored per game by Union Athletic during the same football season.
|
Median number of goals per game |
4 |
|
Lower quartile |
2 |
|
Upper quartile |
7.5 |
|
Lowest number of goals per game |
1 |
|
Highest number of goals per game |
10 |
(a) Draw a box plot for the Union Athletic data.
Draw the box plot by first plotting all five points as vertical lines.
Draw a box around the middle three and then draw whiskers out to the outer two.

(b) Compare the number of goals scored per game by the two teams.
Your first comment should be about averages – do it in two sentences.
Your first sentence should be just about the maths and numbers involved. The second should be about what it means.
The median number of goals per game is higher for Union Athletic (4 goals) than Albion Rovers (3 goals).
This means that on average, Union Athletic scored more goals per game than Albion Rovers.
Your second comment should be about spread – do it in two sentences.
Your first sentence should be just about the maths and numbers involved. The second should be about what it means.
The interquartile range (IQR) is higher for Union Athletic (5.5) than Albion Rovers (3.5).
This means that Albion Rovers were more consistent regarding the number of goals they scored per game.
Remember a smaller range/IQR means more consistent which, depending on the situation, may be desirable.
Responses