
Maths Gcse Wjec-Eduqas Higher
-
Scatter-Graphs-And-Correlation Wjec-Eduqas Higher2 主题
-
Cumulative-Frequency-And-Box-Plots Wjec-Eduqas Higher4 主题
-
Histograms Wjec-Eduqas Higher3 主题
-
Statistical-Diagrams- Wjec-Eduqas Higher6 主题
-
Averages-Ranges-And-Data Wjec-Eduqas Higher8 主题
-
Questionnaires Wjec-Eduqas Higher
-
Population-And-Sampling Wjec-Eduqas Higher
-
Comparing-Data-Sets Wjec-Eduqas Higher
-
Range-And-Interquartile-Range Wjec-Eduqas Higher
-
Averages-From-Grouped-Data Wjec-Eduqas Higher
-
Averages-From-Tables- Wjec-Eduqas Higher
-
Calculations-With-The-Mean Wjec-Eduqas Higher
-
Mean-Median-And-Mode Wjec-Eduqas Higher
-
Questionnaires Wjec-Eduqas Higher
-
Combined-And-Conditional-Probability Wjec-Eduqas Higher3 主题
-
Tree-Diagrams- Wjec-Eduqas Higher1 主题
-
Simple-Probability-Diagrams- Wjec-Eduqas Higher3 主题
-
Introduction-To-Probability Wjec-Eduqas Higher3 主题
-
Transformations Wjec-Eduqas Higher5 主题
-
Vectors Wjec-Eduqas Higher6 主题
-
3D-Pythagoras-And-Trigonometry Wjec-Eduqas Higher1 主题
-
Sine-Cosine-Rule-And-Area-Of-Triangles- Wjec-Eduqas Higher4 主题
-
Pythagoras-And-Trigonometry Wjec-Eduqas Higher4 主题
-
Area-And-Volume-Of-Similar-Shapes Wjec-Eduqas Higher1 主题
-
Congruence-Similarity-And-Geometrical-Proof Wjec-Eduqas Higher5 主题
-
Volume-And-Surface-Area- Wjec-Eduqas Higher3 主题
-
Circles-Arcs-And-Sectors- Wjec-Eduqas Higher2 主题
-
Area-And-Perimeter- Wjec-Eduqas Higher4 主题
-
Circle-Theorems Wjec-Eduqas Higher7 主题
-
Circle-Theorem-Proofs Wjec-Eduqas Higher
-
The-Alternate-Segment-Theorem Wjec-Eduqas Higher
-
Angles-In-The-Same-Segment Wjec-Eduqas Higher
-
Angles-In-Cyclic-Quadrilaterals Wjec-Eduqas Higher
-
Theorems-With-Chords-And-Tangents Wjec-Eduqas Higher
-
Angle-In-A-Semicircle Wjec-Eduqas Higher
-
Angles-At-Centre-And-Circumference Wjec-Eduqas Higher
-
Circle-Theorem-Proofs Wjec-Eduqas Higher
-
Bearings-Scale-Drawing-Constructions-And-Loci Wjec-Eduqas Higher5 主题
-
Angles-In-Polygons-And-Parallel-Lines Wjec-Eduqas Higher3 主题
-
Symmetry-And-Shapes Wjec-Eduqas Higher6 主题
-
Exchange-Rates-And-Best-Buys Wjec-Eduqas Higher2 主题
-
Standard-And-Compound-Units- Wjec-Eduqas Higher5 主题
-
Direct-And-Inverse-Proportion- Wjec-Eduqas Higher2 主题
-
Problem-Solving-With-Ratios Wjec-Eduqas Higher2 主题
-
Ratios Wjec-Eduqas Higher3 主题
-
Sequences Wjec-Eduqas Higher4 主题
-
Transformations-Of-Graphs- Wjec-Eduqas Higher2 主题
-
Graphing-Inequalities- Wjec-Eduqas Higher2 主题
-
Solving-Inequalities- Wjec-Eduqas Higher2 主题
-
Real-Life-Graphs Wjec-Eduqas Higher4 主题
-
Estimating-Gradients-And-Areas-Under-Graphs Wjec-Eduqas Higher2 主题
-
Equation-Of-A-Circle- Wjec-Eduqas Higher2 主题
-
Graphs-Of-Functions Wjec-Eduqas Higher6 主题
-
Linear-Graphs Wjec-Eduqas Higher4 主题
-
Quadratic-Equations Wjec-Eduqas Higher4 主题
-
Linear-Equations- Wjec-Eduqas Higher1 主题
-
Algebraic-Proof Wjec-Eduqas Higher1 主题
-
Rearranging-Formulae Wjec-Eduqas Higher2 主题
-
Coordinate-Geometry- Wjec-Eduqas Higher4 主题
-
Functions Wjec-Eduqas Higher3 主题
-
Forming-And-Solving-Equations Wjec-Eduqas Higher3 主题
-
Iteration Wjec-Eduqas Higher2 主题
-
Simultaneous-Equations Wjec-Eduqas Higher2 主题
-
Algebraic-Fractions- Wjec-Eduqas Higher4 主题
-
Completing-The-Square Wjec-Eduqas Higher1 主题
-
Factorising Wjec-Eduqas Higher6 主题
-
Expanding-Brackets Wjec-Eduqas Higher3 主题
-
Algebraic-Roots-And-Indices Wjec-Eduqas Higher1 主题
-
Introduction-To-Algebra Wjec-Eduqas Higher4 主题
-
Using-A-Calculator Wjec-Eduqas Higher1 主题
-
Surds Wjec-Eduqas Higher2 主题
-
Rounding-Estimation-And-Bounds Wjec-Eduqas Higher2 主题
-
Fractions-Decimals-And-Percentages Wjec-Eduqas Higher3 主题
-
Simple-And-Compound-Interest-Growth-And-Decay Wjec-Eduqas Higher4 主题
-
Percentages Wjec-Eduqas Higher3 主题
-
Fractions Wjec-Eduqas Higher4 主题
-
Powers-Roots-And-Standard-Form Wjec-Eduqas Higher4 主题
-
Prime-Factors-Hcf-And-Lcm- Wjec-Eduqas Higher4 主题
-
Number-Operations Wjec-Eduqas Higher10 主题
-
Product-Rule-For-Counting Wjec-Eduqas Higher
-
Systematic-Lists Wjec-Eduqas Higher
-
Related-Calculations- Wjec-Eduqas Higher
-
Multiplication-And-Division Wjec-Eduqas Higher
-
Addition-And-Subtraction Wjec-Eduqas Higher
-
Money-Calculations- Wjec-Eduqas Higher
-
Negative-Numbers- Wjec-Eduqas Higher
-
Irrational-Numbers Wjec-Eduqas Higher
-
Order-Of-Operations-Bidmasbodmas Wjec-Eduqas Higher
-
Mathematical-Symbols Wjec-Eduqas Higher
-
Product-Rule-For-Counting Wjec-Eduqas Higher
Time-Series-Graphs- Wjec-Eduqas Higher
Exam code:C300
Time series graphs
What is a time series graph?
-
A time series graph is sometimes called a line graph
-
A time series graph shows how a quantity (continuous data) changes over time
-
e.g. How the outside temperature changes during a week (shown below)
-
-
Measurements of the quantity are taken at particular times
-
Measurements should be taken at regular time intervals
-
These are then plotted as points on a time series graph and joined together with straight lines
-
The straight lines help us to identify patterns and features in the data
-
-
Time series graphs can show changes over short or long periods of time
-
e.g. Changes to the temperature of two chemicals for the first few minutes after they’ve been mixed
-
Or changes to the temperature of the earth over several years
-

How do I draw a time series graph?
-
The horizontal axis (x-axis) will be the time axis
-
The vertical axis (y-axis) will be the quantity being measured/recorded
-
Plot the data as a series of points
-
Join one point to the next, in order, with straight lines
-
Use a ruler
-
-
Sometimes a time series graph may have more than one data set
-
e.g. one line for car emissions and one line for motorbike emissions
-
Plot one data set and join the points up before moving on to the second data set
-
This will ensure you do not muddle the points up
-
You could use crosses (×) for one set of points, and dots (•) for the other
-
You could use different colours or dotted/dashed lines when joining the points up
-
Always include a key in such cases to make it clear which line is which data set
-
-
How do I use and interpret a time series graph?
-
This involves looking at patterns in the data as well as specific points
-
If a question asks you to interpret or describe a time series graph look for:
-
A general trend
-
e.g. The rate of inflation may fluctuate (go up and down) but is generally going down over a decade
-
-
Seasonal differences
-
e.g. Sales are higher in the summer months than winter months
-
-
-
Other things to look for
-
a horizontal line between points – no change (constant)
-
the steepest line (gradient) would indicate the greatest change
-
this could be an increase (‘uphill’ left to right, like /)
-
or a decrease (‘downhill’ left to right, like )
-
-
Unusual ‘one-off’ readings – ‘spikes’ or ‘dips’
-
e.g. A spike in mobile phone network activity at midnight on New Year’s eve
-
-
-
For line graphs with two (or more) data sets, be clear about which line you are describing
-
Use the key
-
Double check which data set is ‘higher’ or ‘lower’ (or they may be equal) at a particular time
-
Examiner Tips and Tricks
-
If you are asked to describe or interpret a line graph then it may help to:
-
Draw vertical or horizontal lines on the graph from the respective time or measurement to ensure an accurate reading
-
Use a ruler to do this!
-
-
Highlight any particular points that you mention in your description
-
Worked Example
In a two-hour charity ‘dance-a-thon’ dancers can join and leave the dance floor as they choose.
The number of dancers on the dance floor is recorded every 15 minutes.
The times-series graph below shows the data for the first two hours of the ‘dance-a-thon’.
At 1 h 45 m and 2 h the number of dancers were 3 and 6 respectively.
(a) Add these two recordings to the time-series graph.
Plot the points 105 minutes (1 h 45 m) on the time axis against 3 on the number of dancers axis and 120 minutes against 8 dancers.
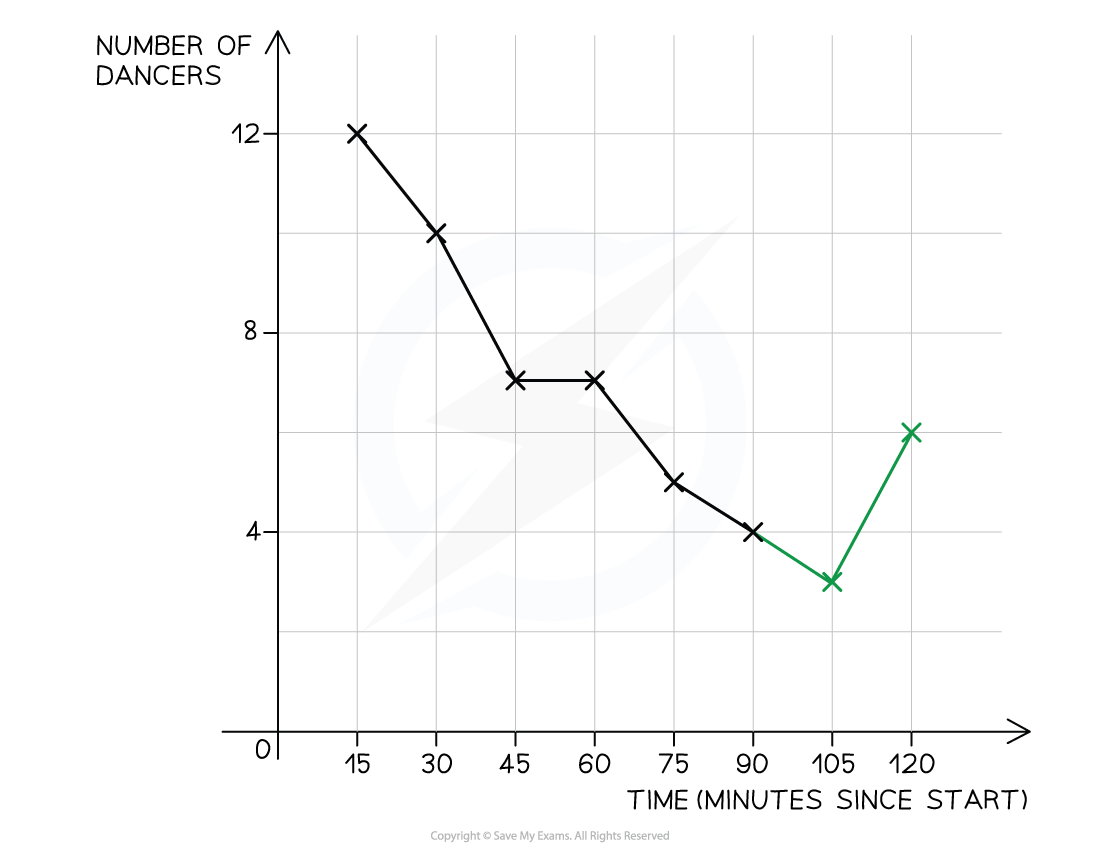
(b) Use the time-series graph to find
(i) the time at which there were the fewest number of dancers,
(ii) the two times at which the number of dancers remained the same.
(i) Look for the lowest point on the graph, including those added in part (a)
The lowest point is (105, 3)
The final answer is the time
105 minutes (1 h 45 m)
(ii) The keyword here is remain – a horizontal line would indicate the number of dancers remaining the same
There is a horizontal line between 45 and 60 minutes
The number of dancers remained the same at 45 m and 60 m (1 h)
(c)
Comment on the general pattern of the number of dancers shown by the time-series graph.
Apart from the last point, and where it remained the same, the number of dancers decreased over the two hours.
In general, the number of dancers decreased during the first two hours of the ‘dance-a-thon’
Responses