
The interaction of supply and demand
-
In a market, prices for goods/services are determined by the interaction of demand and supply
-
A market is any place that brings buyers and sellers together to trade at an agreed price
-
Markets can be physical (e.g. McDonald’s) or virtual (e.g. eBay)
-
Buyers agree on the price by purchasing the good/service
-
If they do not agree on the price, then they do not purchase the good/service
-
-
Based on this interaction with buyers, sellers will gradually adjust their prices until there is an equilibrium price and quantity that works for both parties
-
At the equilibrium price, sellers will be satisfied with the rate/quantity of sales
-
At the equilibrium price, buyers are satisfied that the product provides benefits worth paying for
-
Equilibrium
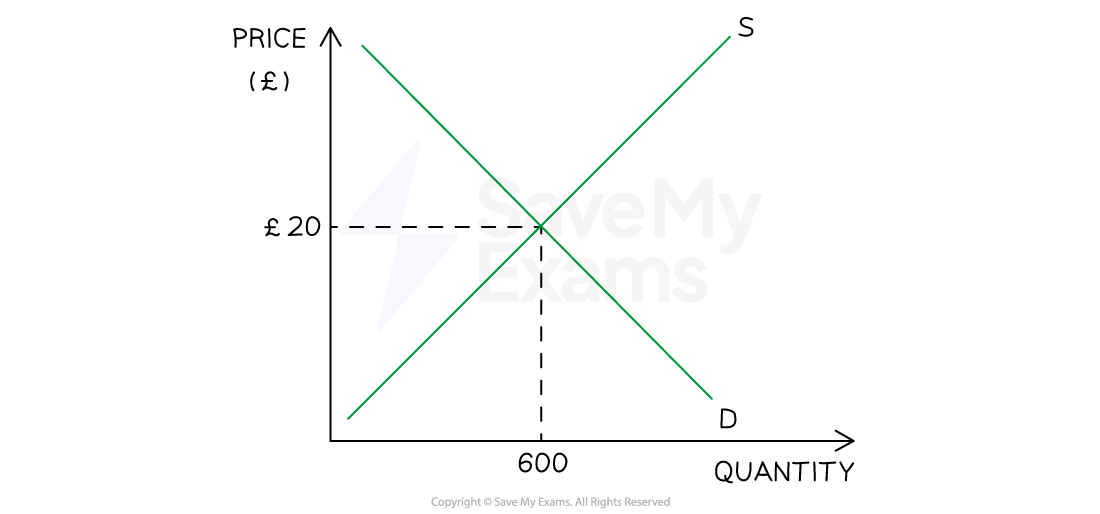
Diagram analysis
-
If the price is set at £20, demand will equal supply, and an equilibrium is reached
-
600 units will be demanded and supplied
-
If the price were set above the equilibrium, supply would be greater than demand, and there would be a surplus
-
If the price were set below the equilibrium, demand would be greater than supply, and there would be a shortage
-
Dynamic changes in markets
-
There are four diagrams that can be used to show the causes and consequences of changes to the non-price factors of demand and supply
The impact of changes to the non-price factors of demand and supply
A rise in demand
Explanation
-
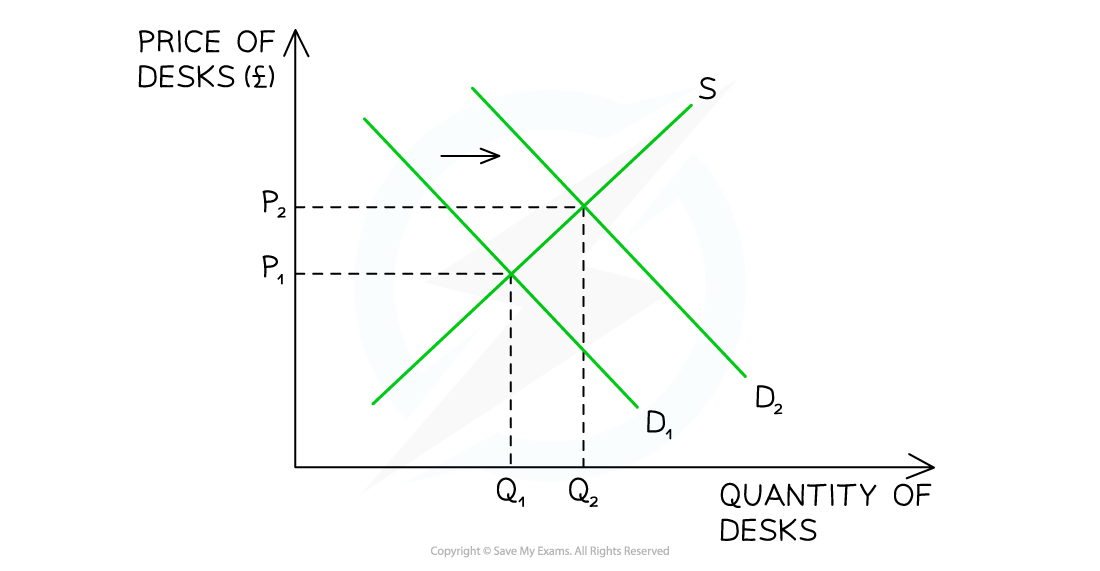
The original equilibrium was at P1 and Q1
-
A rise in demand causes the demand curve to shift to the right from D1→ D2 (perhaps due to an increase in working from home)
-
At the original price of P1, there is now a shortage, as demand exceeds the supply
-
The shortage causes prices to rise from P1 to P2
-
A new equilibrium develops at a price of P2 and a quantity of Q2 units
-
The business revenue (P × Q) has changed from P1Q1 to P2Q2
A fall in demand

Explanation
-
The original equilibrium was at P1 and Q1
-
A fall in demand causes the demand curve to shift to the left from D1→D2 (perhaps due to an external shock)
-
At the original price of P1, there is now a surplus, as supply exceeds demand
-
The surplus causes prices to fall from P1 to P2
-
A new equilibrium develops at a price of P2 and a quantity of Q2 units
-
The business revenue (P × Q) has changed from P1Q1 to P2Q2
A rise in supply

Explanation
-
The original equilibrium was at P1 and Q1
-
A rise in supply causes the supply curve to shift to the right from S1→S2 (perhaps due to an increase in productivity)
-
At the original price of P1, there is now a surplus, as supply exceeds demand
-
The surplus causes prices to fall from P1 to P2
-
A new equilibrium develops at a price of P2 and a quantity of Q2 units
-
The business revenue (P × Q) has changed from P1Q1 to P2Q2
Responses