
Business_A-level_Edexcel
-
1-marketing-and-people
1-1-meeting-customer-needs3 主题 -
1-2-market5 主题
-
1-3-marketing-mix-and-strategy5 主题
-
1-4-managing-people5 主题
-
1-5-entrepreneurs-and-leaders6 主题
-
2-managing-business-activities2-1-raising-finance4 主题
-
2-2-financial-planning4 主题
-
2-3-managing-finance3 主题
-
2-4-resource-management4 主题
-
2-5-external-influences3 主题
-
3-business-decisions-and-strategy3-1-business-objectives-and-strategy4 主题
-
3-2-business-growth4 主题
-
3-3-decision-making-techniques4 主题
-
3-4-influences-on-business-decisions4 主题
-
3-5-assessing-competitiveness3 主题
-
3-6-managing-change3 主题
-
4-global-business4-1-globalisation5 主题
-
4-2-global-markets-and-business-expansion5 主题
-
4-3-global-marketing3 主题
-
4-4-global-industries-and-multinational-corporations3 主题
-
5-exam-technique5-1-the-exam-papers4 主题
-
5-2-business-studies-skills1 主题
-
5-3-structuring-your-responses5 主题
-
6-pre-release-preparation2025-pre-release-music-industry9 主题
1-2-2-supply
An introduction to supply
-
Supply is the number of goods/services businesses are willing to sell at a given price in a specific time period
-
There is a direct relationship between supply and price
-
As the price increases, the quantity supplied increases
-
As the price decreases, the quantity supplied decreases
-
At higher prices, businesses are incentivised to supply more of the product
-
Hence, the supply curve slopes upwards from left to right
-
A simple supply curve
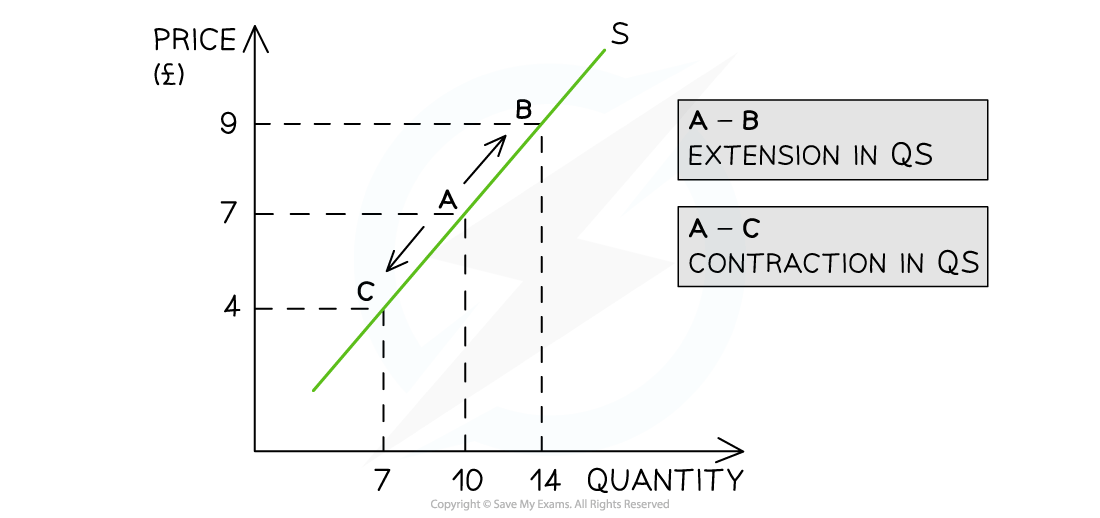
Diagram analysis
-
An increase in price from £7 to £9 leads to a move up the supply curve, from point A to point B
-
Due to the increase in price, the quantity supplied (QS) has increased from 10 to 14 units
-
-
A decrease in price from £10 to £7 leads to a movement down the supply curve, from point A to point C
-
Due to the decrease in price, the QS has decreased from 10 to 7 units
-
Examiner Tips and Tricks
When writing about a movement along the supply curve, we use the term “quantity supplied“.
Factors leading to a change in supply
-
A change in price causes a movement along the supply curve
-
A change in any other factor affecting supply will shift the entire supply curve to the left or right
-
These are called non-price factors affecting supply
-
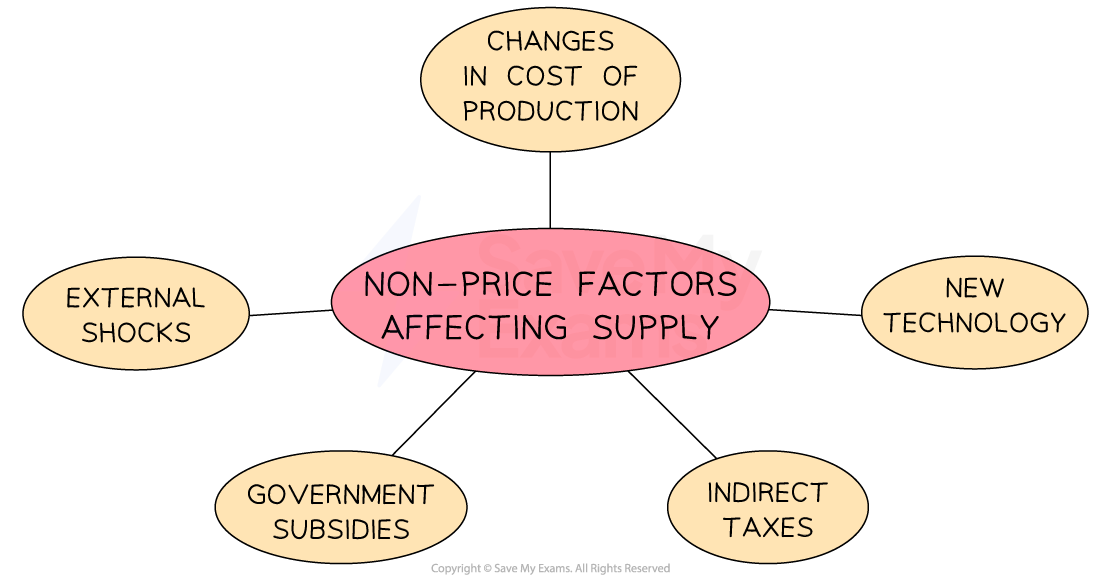
Non-price factors affecting supply
-
For example, if a firm’s cost of production increases due to an increase in the price of a key resource, then there will be a decrease in supply, as the firm can now only afford to produce fewer products
-
This causes a shift in supply from S to S1. The price remains unchanged at £7, but the supply has decreased from 10 to 2 units
Changes in non-price factors
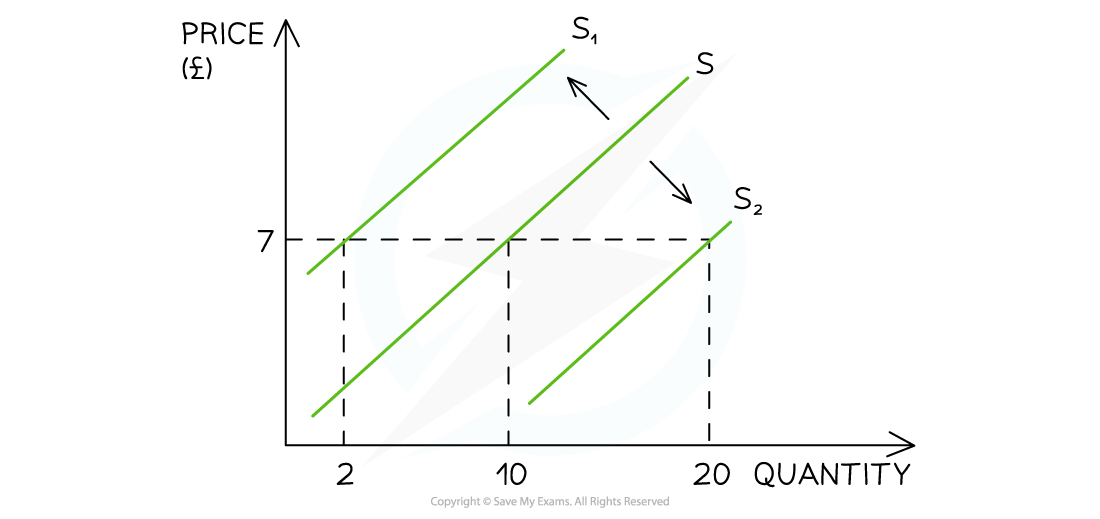
Diagram analysis
-
The initial supply curve is seen at S
-
At a price of £7, 10 units are supplied
-
-
If the price remains constant at £7 but supply decreases due to one of the non-price factors of supply (e.g. workers’ wages increase), the entire supply curve will shift to the left, from S to S1
-
Supply has decreased from 10 to 2 units
-
-
If the price remains constant at £7 but supply increases due to one of the non-price factors of supply (e.g. cost of production falls), the entire supply curve will shift to the right, from S to S2
-
Supply has increased from 10 to 20 units
-
Non-price factors affecting supply
|
Non-price factor |
Explanation |
Examples |
|---|---|---|
|
Change in the costs of production |
|
|
|
New technology |
|
|
|
Indirect taxes |
|
|
|
Government subsidies |
|
|
|
External shocks |
|
|
Examiner Tips and Tricks
Remember, a change in any factor that leads to less supply will shift the supply curve to the left, but a change in any factor that leads to more supply will shift the supply curve to the right.
Responses