
Biology_Edexcel_A-snab_Alevel
-
the-circulatory-system8 主题
-
diet-and-health11 主题
-
gas-exchange-cell-membranes-and-transport8 主题
-
nucleic-acids3 主题
-
proteins10 主题
-
inheritance7 主题
-
cell-structure-and-organisation7 主题
-
cell-division3 主题
-
reproduction-and-inheritance4 主题
-
differentiation-and-variation5 主题
-
biodiversity9 主题
-
resources-from-plants10 主题
-
plant-cell-structure
-
plant-stems
-
importance-of-water-and-inorganic-ions-to-plants
-
starch-and-cellulose-structure-and-function
-
plant-fibres
-
practical-identifying-tissue-types-within-stems
-
tensile-strength-plant-fibres
-
development-of-drug-testing
-
antimicrobial-properties-of-plants
-
sustainability-and-plant-materials
-
plant-cell-structure
-
ecosystems-and-energy-transfer7 主题
-
photosynthesis7 主题
-
climate-change10 主题
-
the-effects-of-climate-change
-
temperature-and-enzyme-activity
-
practical-temperature-and-development-of-organisms
-
climate-change-and-the-scientific-community
-
carbon-cycle-and-reduction-of-atmospheric-carbon-dioxide
-
reducing-climate-change
-
introduction-to-climate-change
-
evidence-for-the-causes-of-climate-change
-
the-greenhouse-effect
-
models-of-future-climate-change
-
the-effects-of-climate-change
-
evolution3 主题
-
forensics3 主题
-
microorganisms-and-immunity11 主题
-
muscles-and-movement3 主题
-
respiration7 主题
-
homeostasis4 主题
-
exercise4 主题
-
response-to-the-environment8 主题
-
the-brain-behaviour-and-disease10 主题
practical-determining-distribution-and-abundance
Practical: Determining Distribution & Abundance
-
Finding out about the abundance and distribution of species can be achieved by counting all of the organisms present in a habitat
-
This is possible for areas that are very small or where the species are very large
-
For larger and more complex habitats it is not possible to find, identify, and count every organism that is present
-
When this is the case sampling can be used to make an estimate for the total species numbers
Sampling
-
Sampling is a method of investigating the abundance and distribution of species and populations
-
There are two different types of sampling
-
Random
-
Systematic
-
-
In random sampling the positions of the sampling points are selected at random
-
This method avoids bias by the person that is carrying out the sampling
-
Bias can affect the results e.g.
-
A student might choose to carry out samples in a particular location because it looks interesting, and this might give the impression that the habitat contains more species than it really does
-
-
-
In systematic sampling the positions of the sampling points are located at fixed intervals throughout the sampling site
-
This avoids accidentally missing out sections of habitat due to chance
-
Systematic sampling allows researchers to investigate the effect of the presence of certain environmental features on species distribution e.g. by taking samples along a line that extends away from an environmental feature such as a river
-
A line of this type is known as a transect
-
-
-
When a sampling area is reasonably uniform then random sampling is the best choice
-
Random sample sites can be selected by
-
Laying out a grid over the area to be studied
-
Generating random number co-ordinates
-
Placing sample sites in the grid squares that match the random number co-ordinates
-
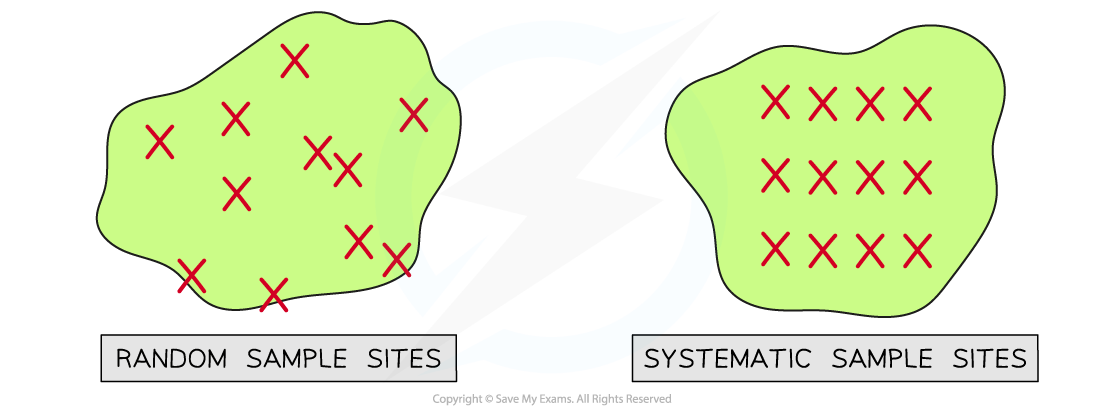
Random sampling involves selecting sample sites at random while systematic sampling involves placing sample sites at regular intervals.
Determining distribution and abundance
-
The distribution and abundance of a species in an area can be assessed using different practical methods:
-
Frame and point quadrats
-
Line and belt transects
-
Frame quadrats
-
A frame quadrat is a square frame that is placed within the area to be studied to provide a sample
-
Quadrats are used to study the distribution of sessile organisms
-
Quadrats can be different sizes depending on the species being studied
-
A 1 m² quadrat can be used to study small organisms such as herbaceous plants in a grassland or limpets on a rocky shore
-
A 400 m² quadrat can be used to study large organisms such as trees
-
Quadrats like this will usually be marked out with string rather than a frame!
-
-
-
-
Frame quadrats can be placed in a habitat randomly, e.g. using random co-ordinates, or systematically, e.g. along a transect
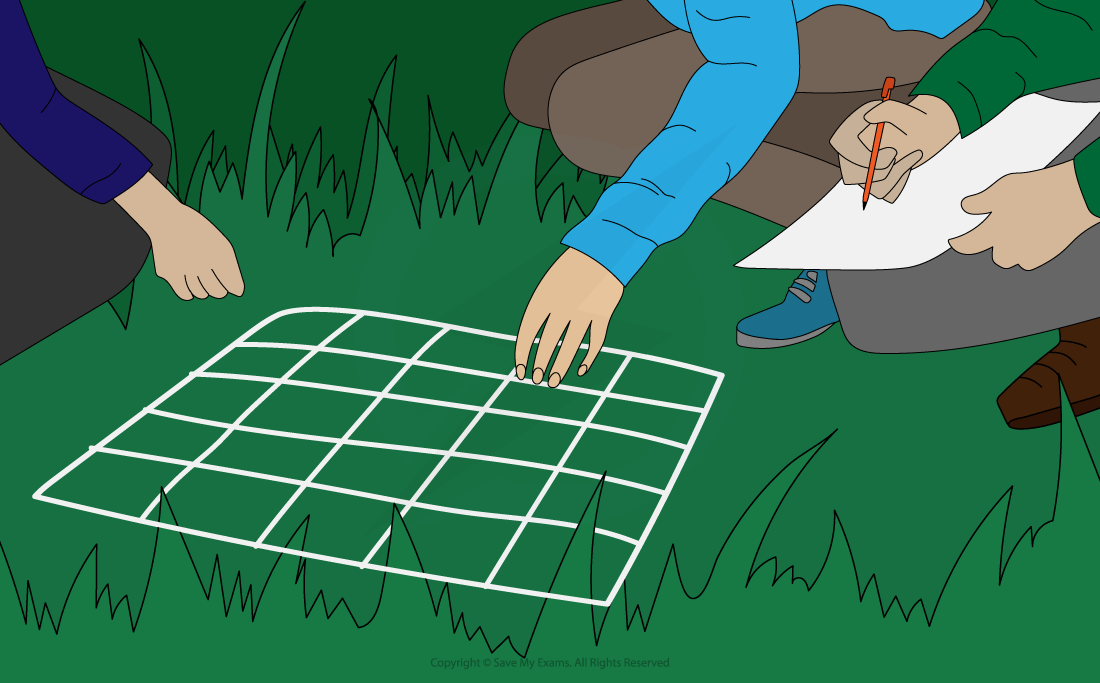
A frame quadrat can be used to measure abundance and distribution
-
Scientists can record different types of data from a frame quadrat depending on the aim of a study and the species involved
-
Presence or absence of a species
-
Species frequency; how many individuals are in the quadrat
-
Species abundance; measured on a scale called the ACFOR scale on which species are recorded as being abundant, common, frequent, occasional, rare, or none
-
Percentage cover; the percentage of the quadrat covered by a species
-
Quadrats can be divided up into smaller squares to allow percentage cover to be assessed more easily
-
-
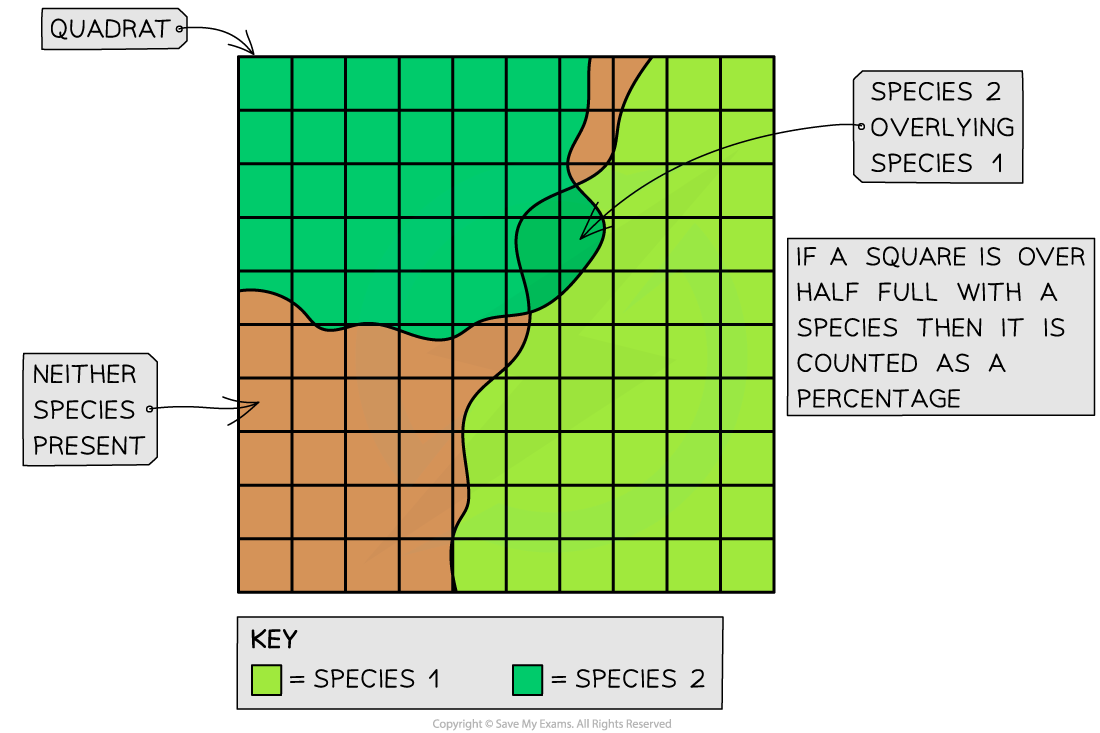
Abundance in a frame quadrat can be assessed by measuring percentage cover
Point quadrats
-
A point quadrat is a vertical frame with holes across the top through which pins are lowered
-
This is useful in areas with dense plant cover as the ground may be difficult to study using a frame quadrat
-
Point quadrats can be placed in a habitat randomly, e.g. using random co-ordinates, or systematically, e.g. along a transect
-
-
When a lowered pin touches a species, that species is recorded as being present
-
If several species are touching the pin then all of those species are recorded
-
-
Point quadrats can be used to measure abundance in the following ways
-
The number of individuals of a species present
-
Each individual that touches a pin is recorded
-
-
Percentage cover of a species
-
The number of pins touched by a species is divided by the total number of pins used
-
Most point quadrats have ten pins, so if all the pins are used then a species touching one pin counts as 10 percent cover
-
-

Point quadrats can be used to measure the number of individuals of a species or percentage cover.
Transects
-
Transects are lines laid out across a site that can be used to measure abundance and distribution across a habitat
-
Transects are useful for determining how species abundance and distribution might change along a gradient e.g. at increasing distances from a field margin or perpendicular to the water’s edge on a rocky shore
-
-
To carry out a transect, a tape measure is laid out along the gradient of interest, and samples are taken along the line
-
There are different ways of carrying out transect studies
-
Continuous line transect
-
Every species touching the tape measure is recorded
-
-
Interrupted line transect
-
Species touching the line at regular intervals, e.g. every metre, are recorded
-
-
Continuous belt transect
-
Frame quadrats are placed end-to-end along the line
-
-
Interrupted belt transect
-
Frame or point quadrats are placed at regular intervals, e.g. every metre, along the line
-
-
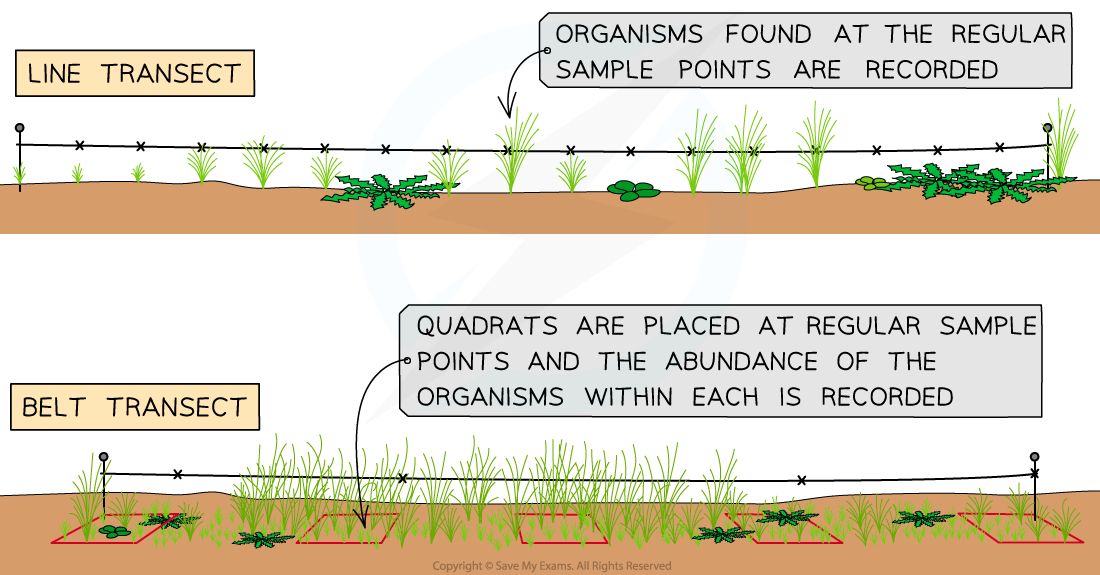
Interrupted line and belt transects can be used to measure abundance and distribution of species along a line across a habitat
Measuring abiotic factors
-
The distribution and abundance of species in a habitat are affected by abiotic factors
-
When investigating the impact of an abiotic factors on species abundance and distribution it is important to measure the relevant abiotic factors at the sample sites
-
It is only necessary to record relevant abiotic factors
-
A study may only be interested in one particular abiotic factor
-
Some abiotic factors may not be relevant in certain habitats e.g. water turbidity (cloudiness) will not be relevant in a woodland habitat
-
-
-
Abiotic factors can be measured using specialised equipment and techniques
Measuring Abiotic Factors Table

Representing results
-
The results of an investigation into the distribution and abundance of organisms can be represented visually using a type of graph known as a kite diagram
-
Kite diagrams can show both distribution and abundance
-
The distribution of a species along a transect can be shown by its position along a central horizontal line in each section of a kite diagram
-
Each section represents a different species
-
The distance along the transect is given on the x-axis, to which the horizontal line is parallel
-
-
The
-